SSE Dashboard
Axis Security SSE Dashboard
Overview

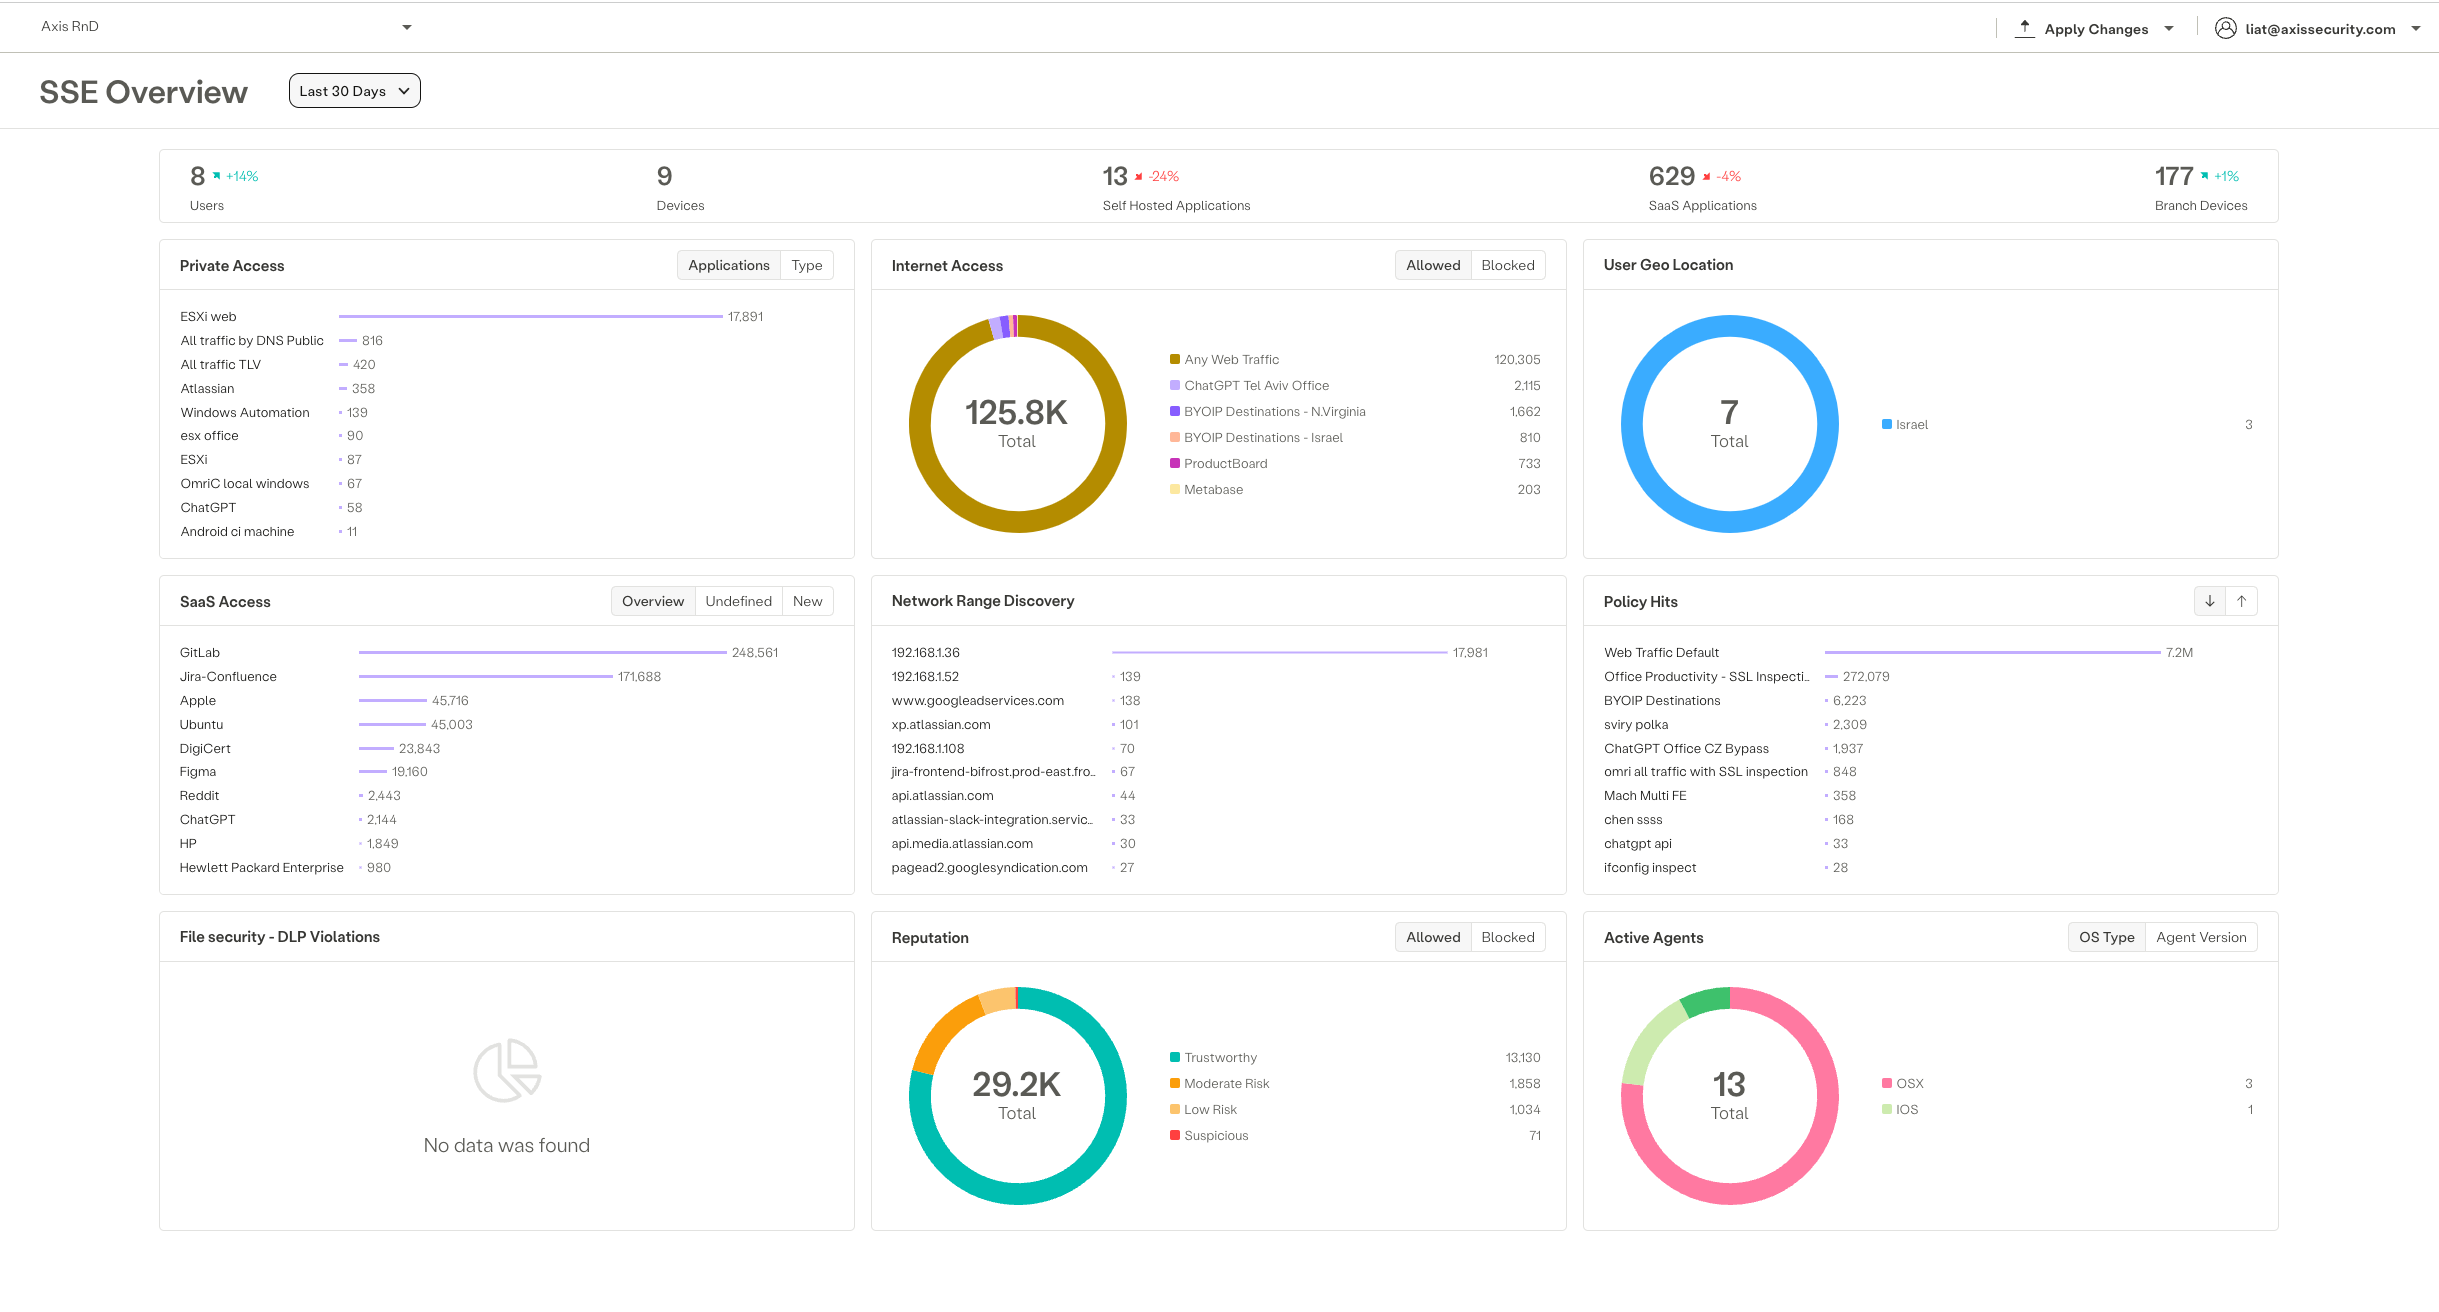
This main page is your central hub for managing and monitoring your Zero Trust Network Access (ZTNA), Secure Web Gateway (SWG), and Cloud Access Security Broker (CASB) services. The dashboard provides a comprehensive overview of various security and access metrics through interactive widgets and tabs.
Big Numbers

1. Users and Devices
- Users: Displays the total number of users accessing the network over the last 7,14,30 days, including the percentage change compared to the previous period.
- Devices: Shows the total number of devices connected to the network, along with the percentage change.
2. Self-Hosted Applications
- Self-Hosted Applications: Indicates the number of self-hosted applications accessed, including the percentage change.
3. SaaS Applications
- SaaS Applications: Displays the total number of SaaS applications accessed, with the percentage change.
4. Branch Devices
- Branch Devices: Shows the number of branch devices connected..
Private Access

- Applications: Lists the applications accessed through private networks, with metrics such as traffic volume.
- Type: Categorizes the types of applications accessed based on self-hosted app type.
Internet Access
- Allowed/Blocked: Pie chart showing the total amount of internet traffic, with sections for allowed and blocked traffic.
User Geo Location
- Country: Pie chart displaying the geographical distribution of users, showing the number of users by country.
SaaS Access
- Overview/Undefined/New:
- Overview: A list of SaaS applications accessed, with metrics for each.
- Undefined: Applications without defined access policies.
- New: Newly accessed SaaS applications.
Network Range Discovery
- List of IPs/Domains: A list showing IP addresses or domains discovered within the network range, with the number of times each was accessed.
Policy Hits
- Policy Hits: Shows the number of hits for various security policies, indicating which policies are most frequently triggered.
File Security - DLP Violations
- DLP Violations: Displays data loss prevention (DLP) violations, with a breakdown of the types of files involved, such as images.
Reputation
- Allowed/Blocked: Pie chart displaying the reputation of the accessed resources, categorized by trustworthiness, moderate risk, low risk, and suspicious.
Active Agents
- OS Type/Agent Version:
- OS Type: Pie chart showing the distribution of active agents by operating system (e.g., OSX, Windows, Android).
- Agent Version: Information on the versions of the agents currently active.
Navigation Tabs
- Insights: Access detailed insights into network and application usage, user activities, and security events.
- Policy: Configure and manage security policies for applications, users, and devices.
- Settings: Adjust dashboard settings, user permissions, and other configurations.
- Experience: Monitor and manage the user experience, including performance metrics and user feedback.
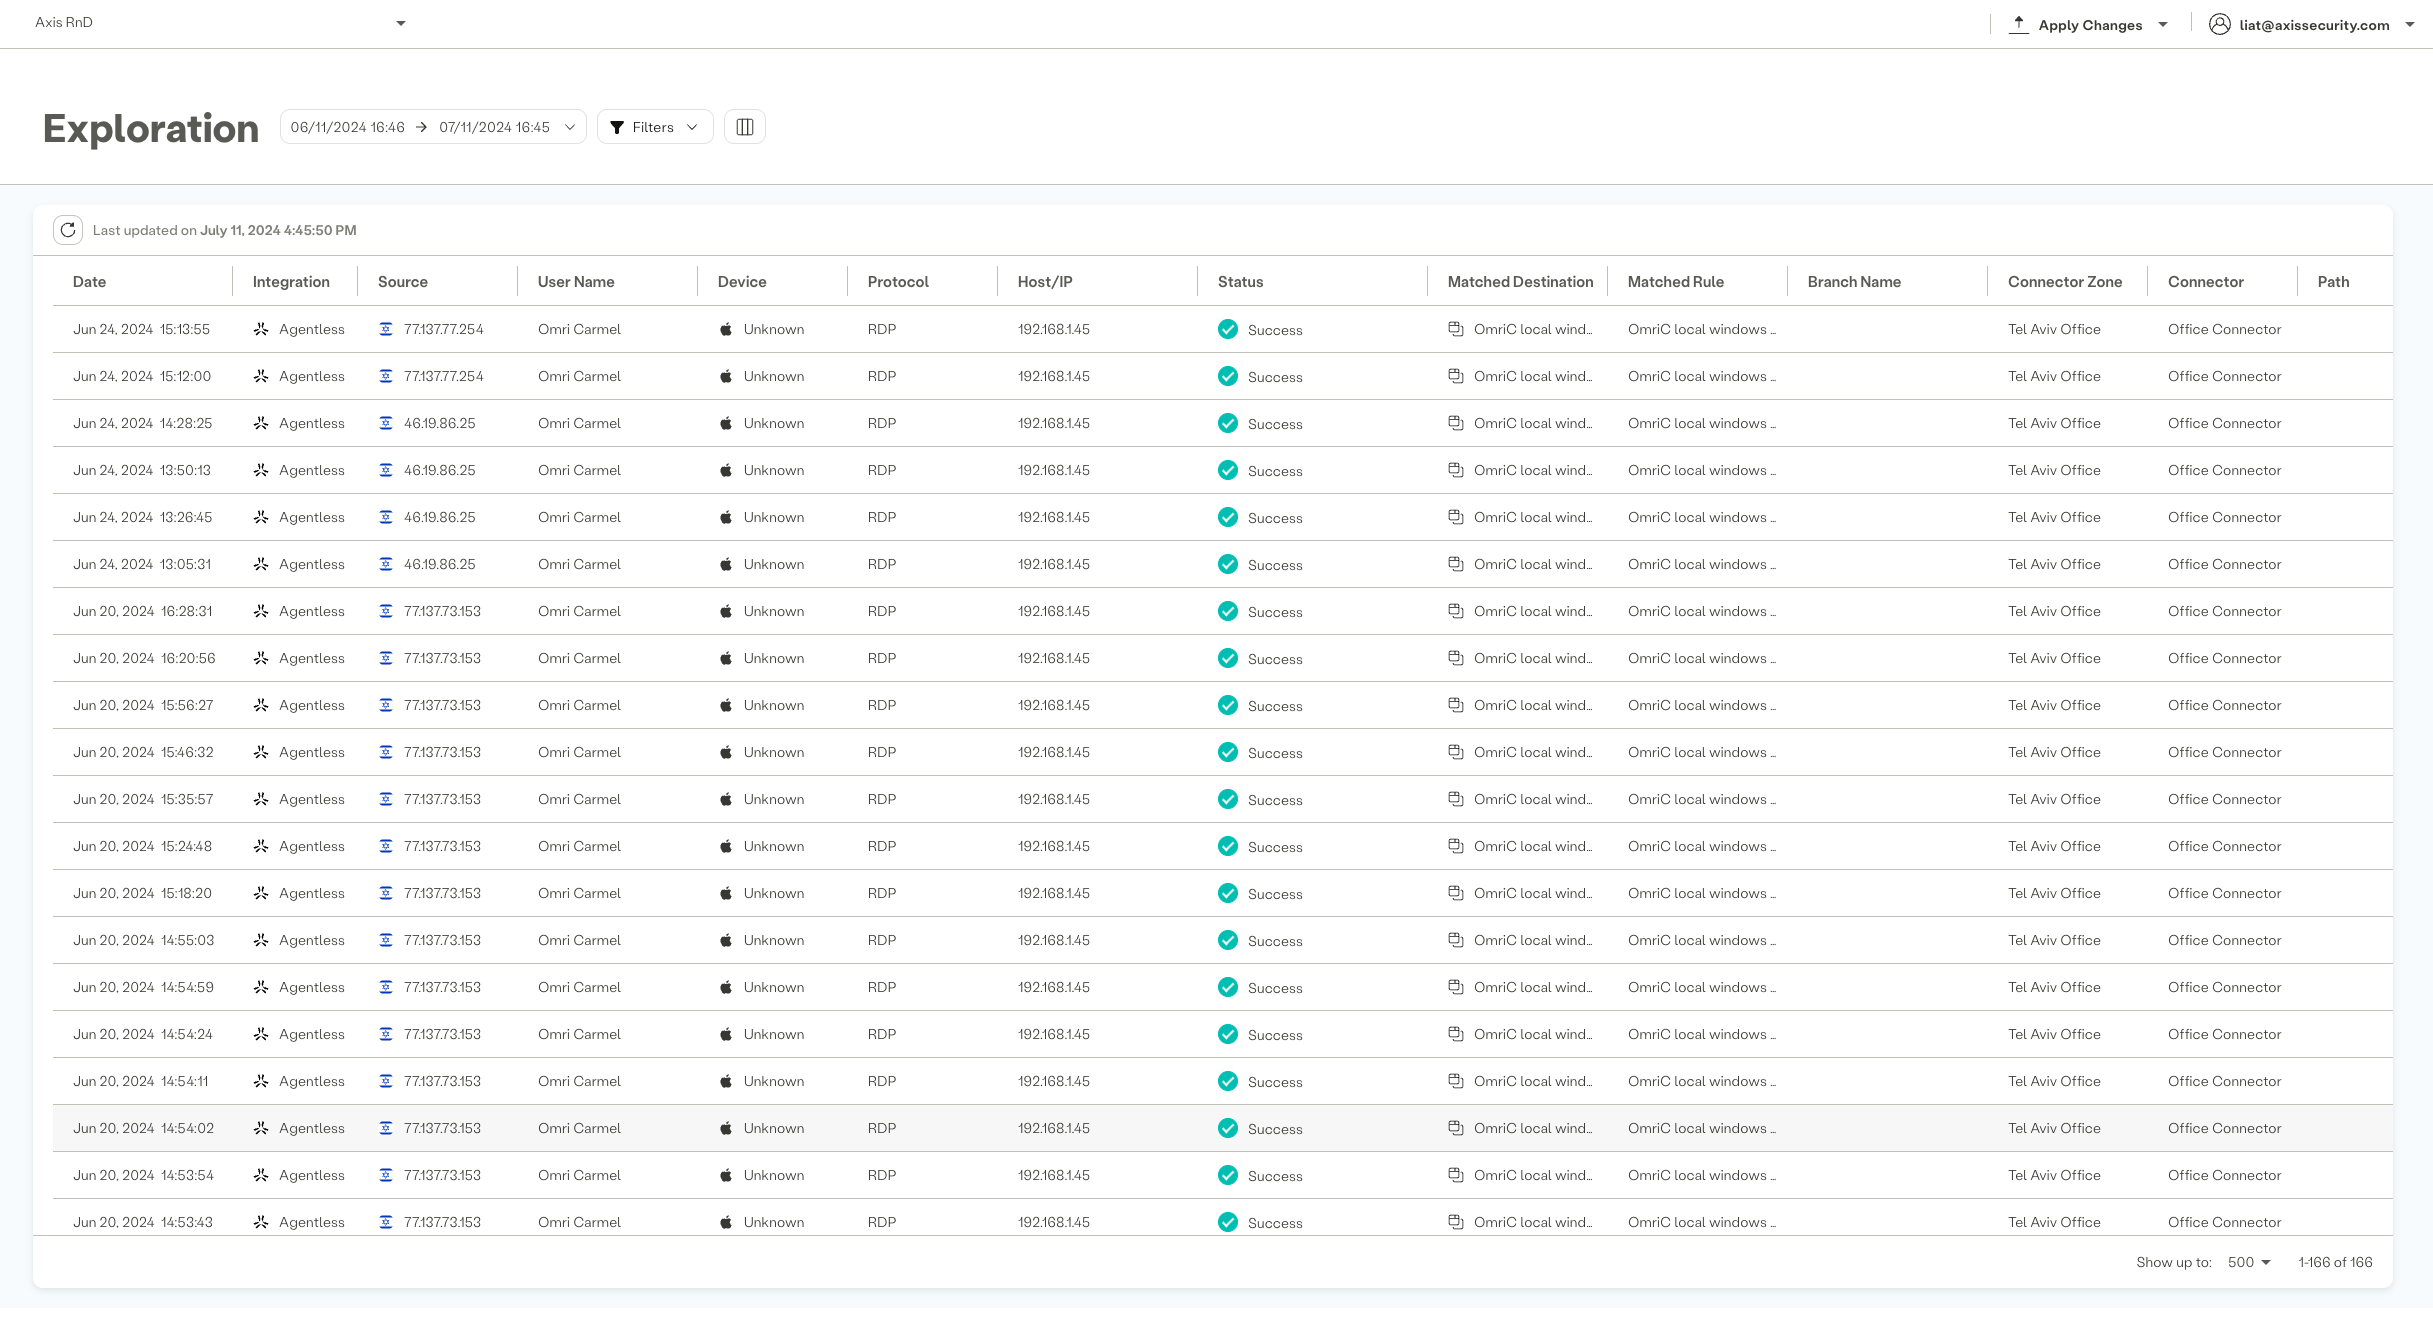
Exploration

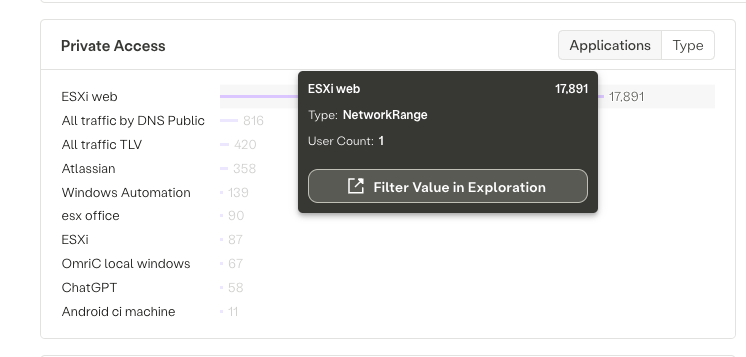
Each item within the dashboard is interactive and can be clicked to navigate to a more detailed view in the "Exploration" section. This feature allows you to apply relevant filters and dive deeper into specific data points, providing a more granular understanding of network activities and security metrics.
Usage Tips
- Hover over graphs and charts for detailed metrics.
- Use filters to view specific data ranges or types.
- Click on any item to explore detailed data in the "Exploration" section.
- Check the dynamic updates to stay informed about real-time changes in network activity and security status.
By understanding each widget and tab, and utilizing the interactive exploration features, you can effectively monitor and manage your network's security, ensuring compliance and protecting against threats.
Updated 2 months ago
