Sending Logs to Splunk Enterprise and Splunk Cloud
Axis Security supports sending logs to Splunk Enterprise and Splunk Cloud.
Installation in Axis Security
Prerequisites
- Splunk Cloud or Enterprise Administrator access to install the Axis Security Technical Add-on (TA) and add a Data Input.
- Axis Administrator access to create a Splunk API key.
Creating Log Streaming to Splunk
- Go to Settings-> Log Streaming -> New Log Streaming.
- Select Splunk.
- Configure the following options:
Name: Add a meaningful name for the Splunk Integration.
Description: Add a description. - Click Submit.
New Log Streaming
- Download Application.
- Copy the API key. Note: Once the window is closed, the code will no longer be available.
- Click OK.
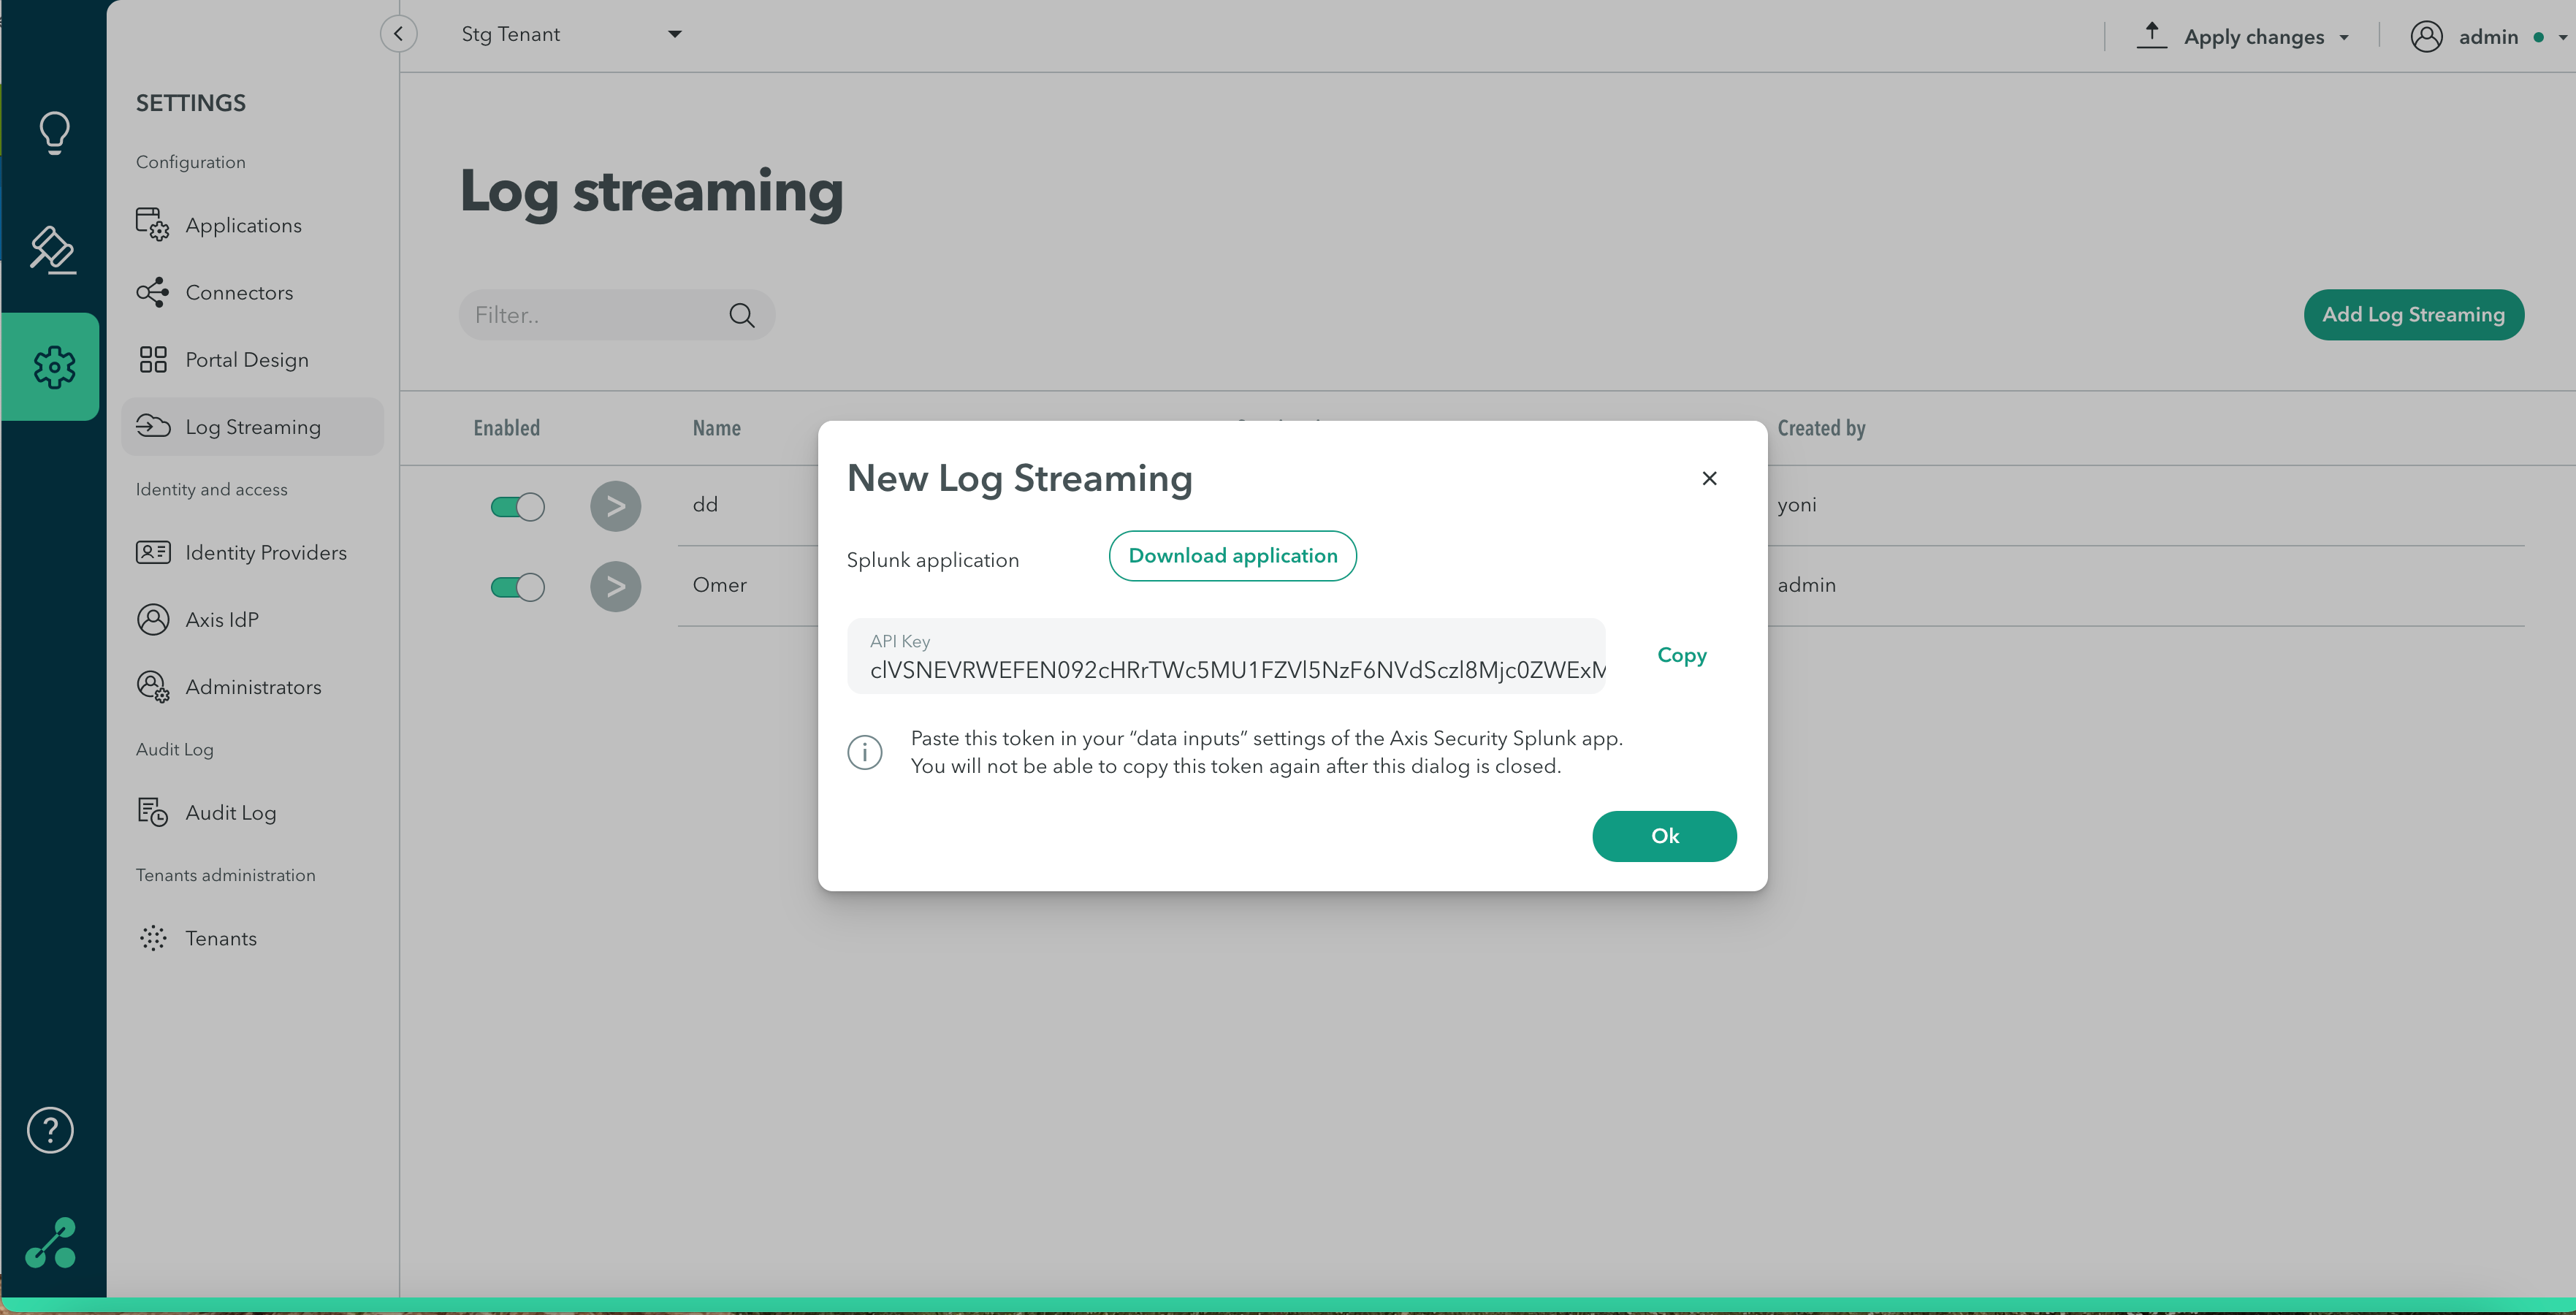
NoteTo commit your changes, navigate to the top-right menu, click Apply Changes, then select Commit Changes.
Sending Logs to Splunk Enterprise
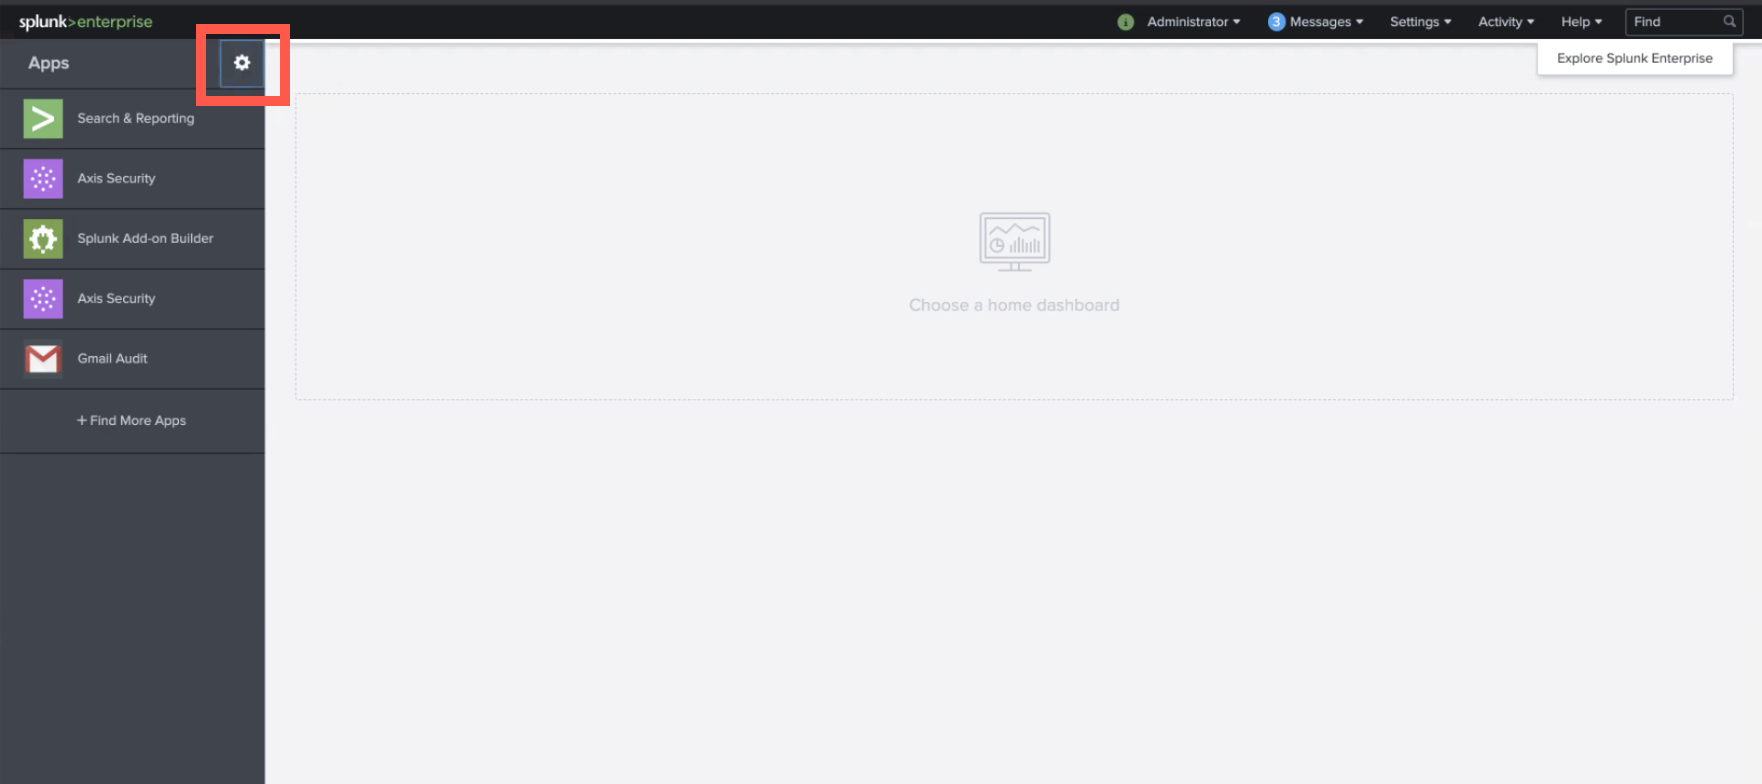
- In Splunk, click the cog wheel in the upper left corner.
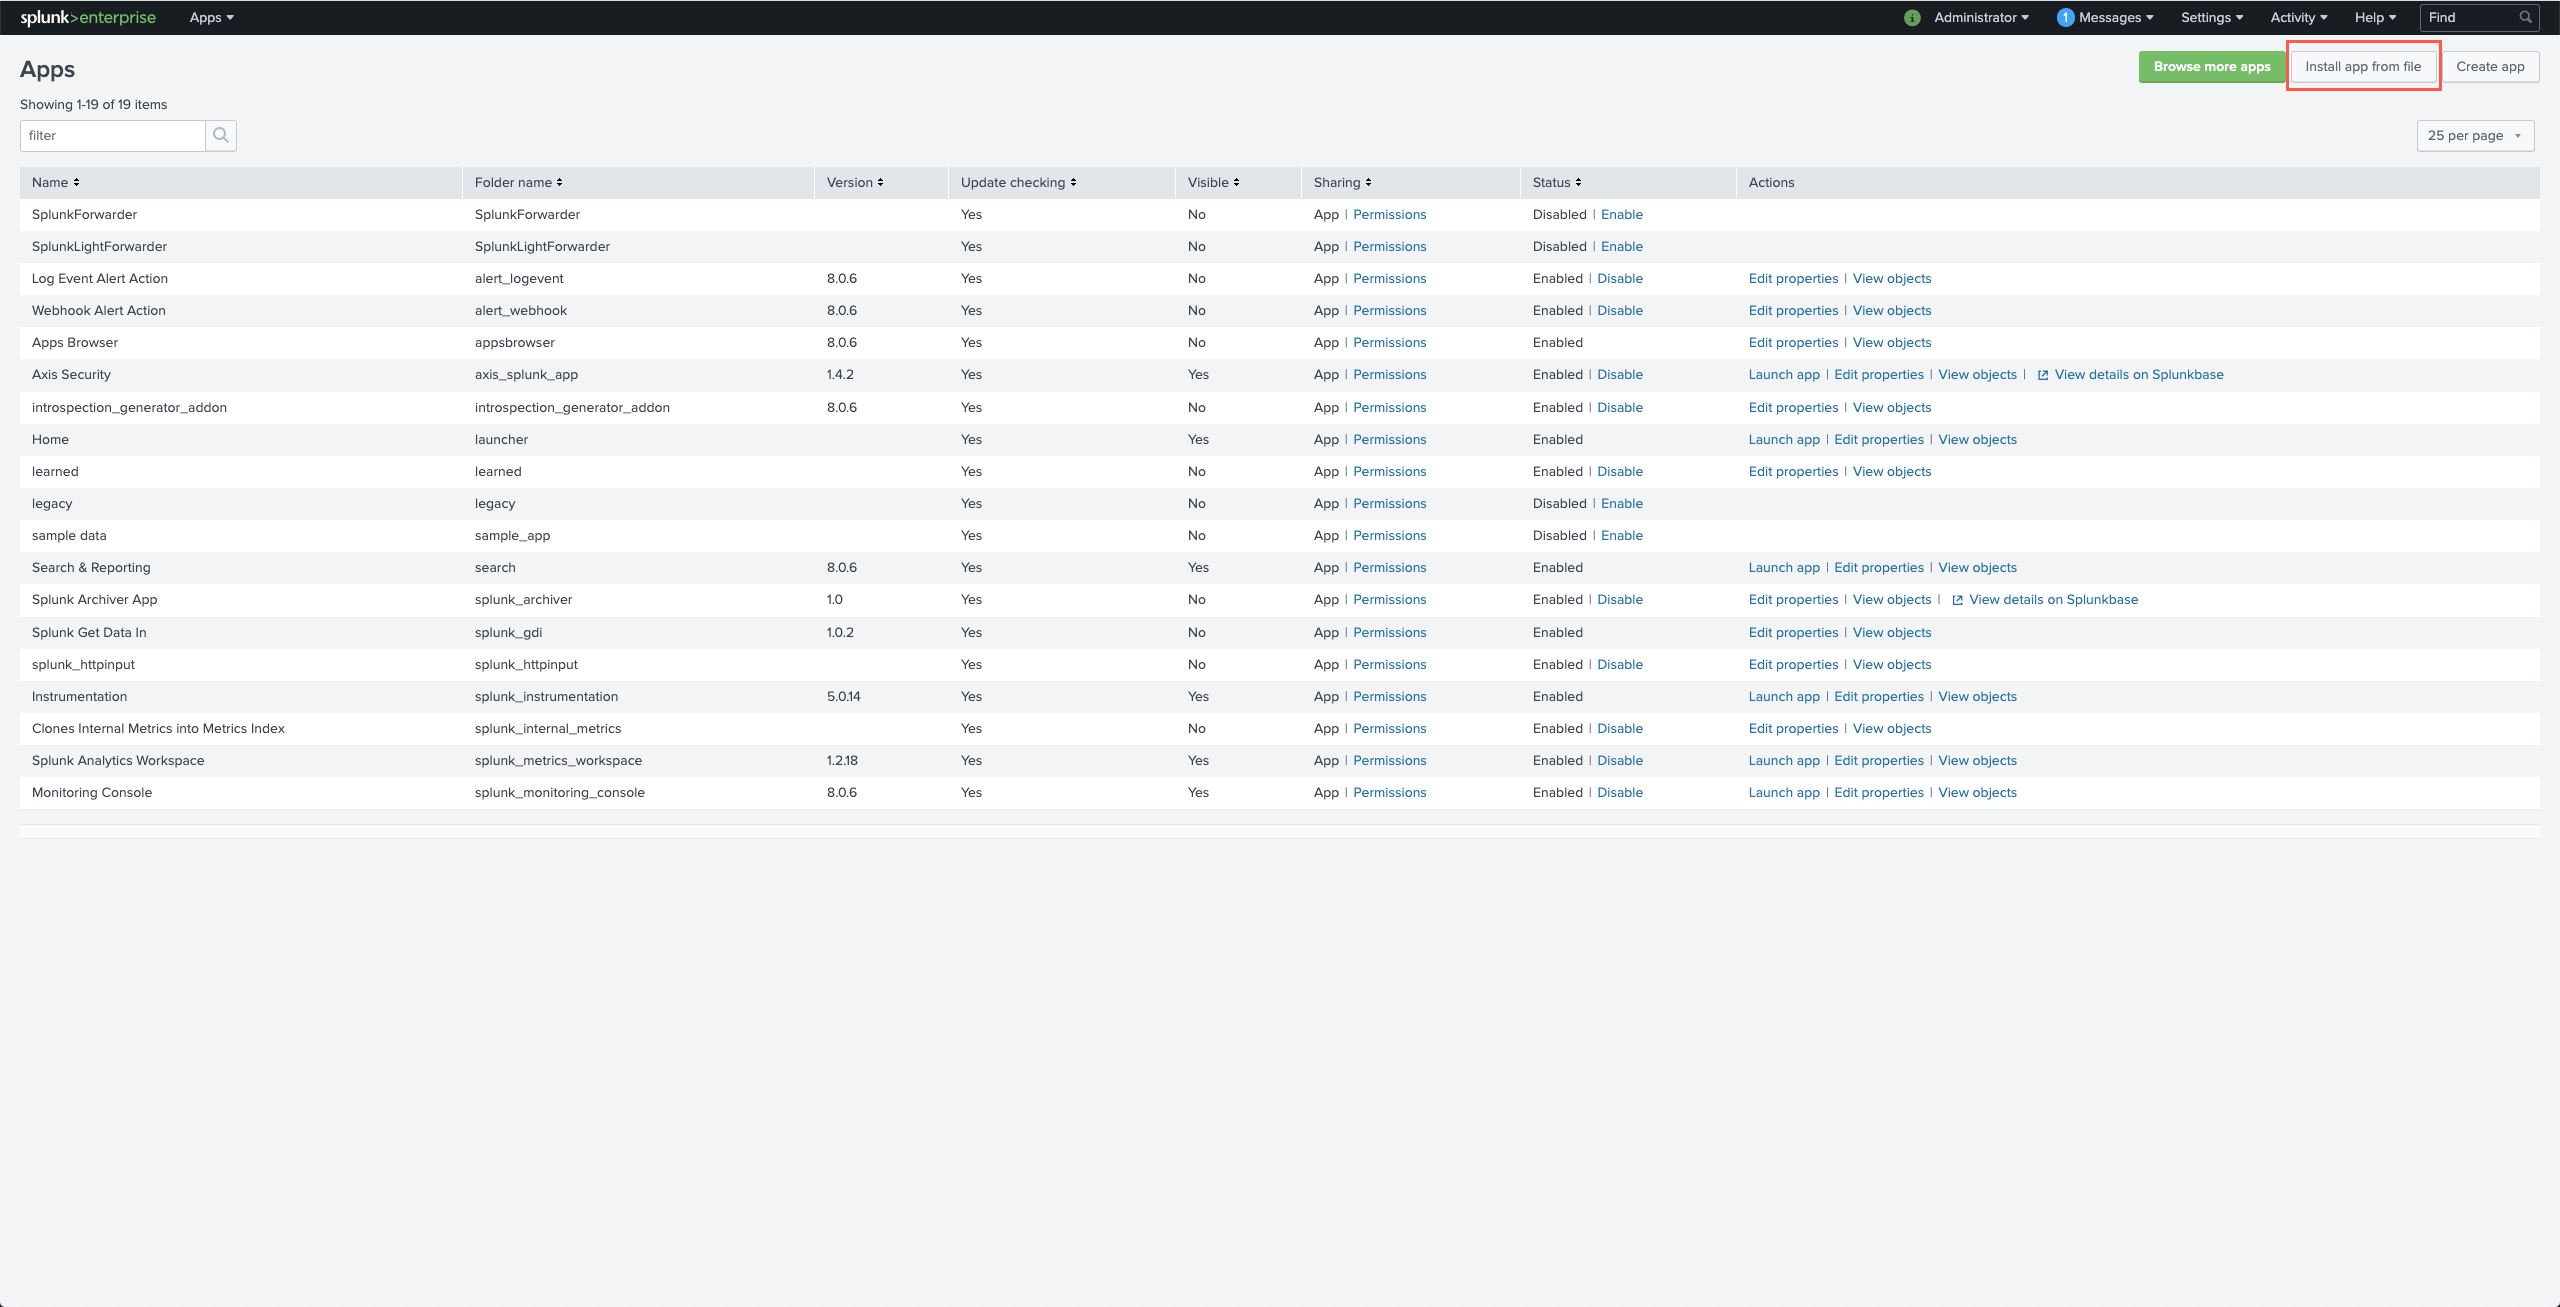
- Click Install app from file in the upper right corner.
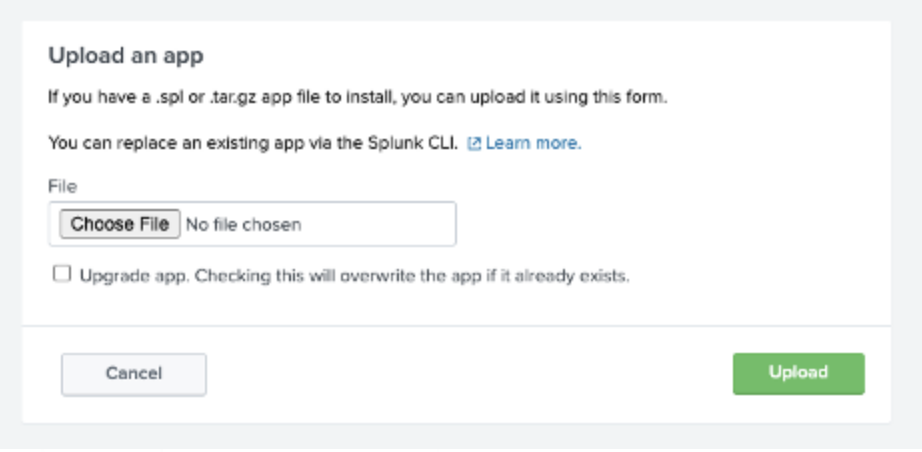
- Click the Choose File option to upload the file downloaded from Management Console (“axis_splunk_app.zip”)
- Click Settings-> Data inputs.
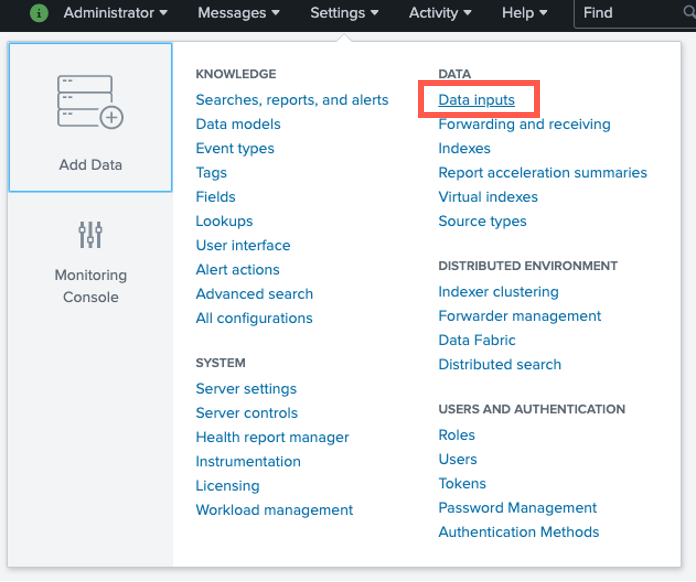
- Click Add new next to Axis Security modular input.

- Provide a name, paste the token (API key) copied from the Management Console, and enter a value for logs severity- the minimum severity for writing the Splunk application’s logs.
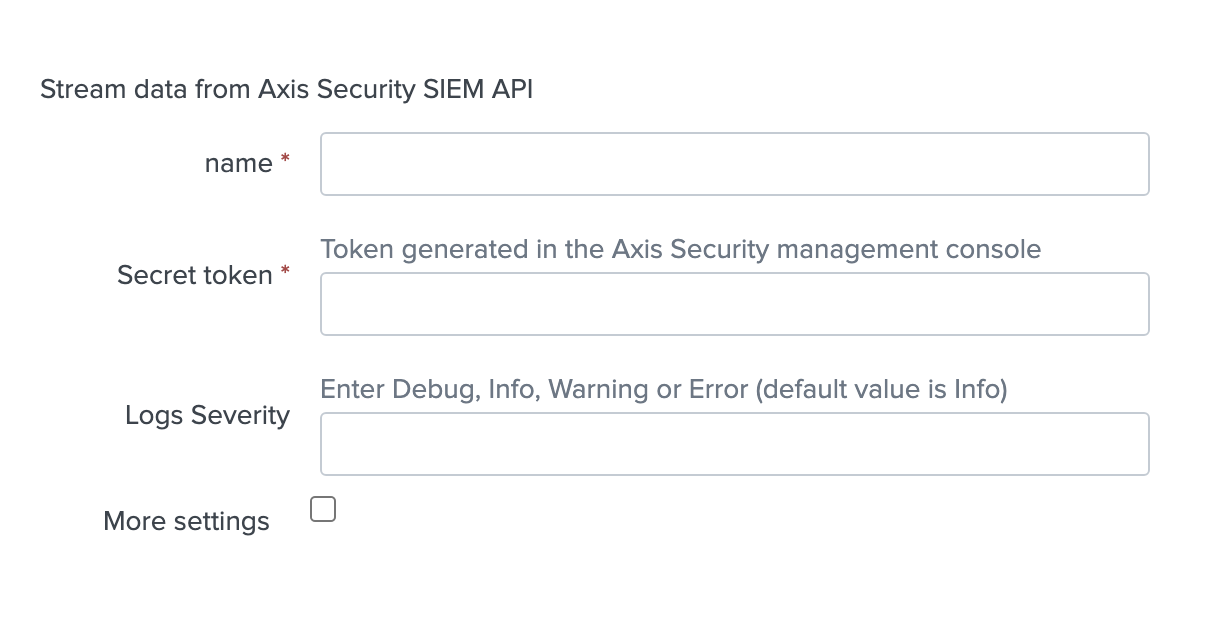
- You can change index by checking More settings and inserting your preferred index (the default index is “main”).
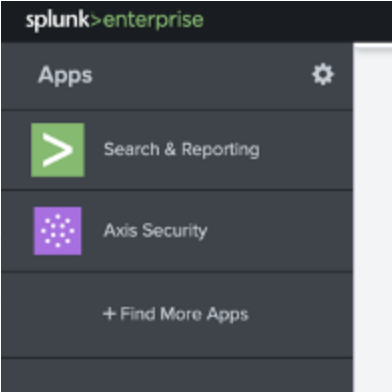
- In your Splunk main page you should now see “Axis Security” integration.
Sending logs to Splunk Cloud
Verifying Your Splunk Experience
Note: If you are using the Victoria experience, refer to the known issues section.
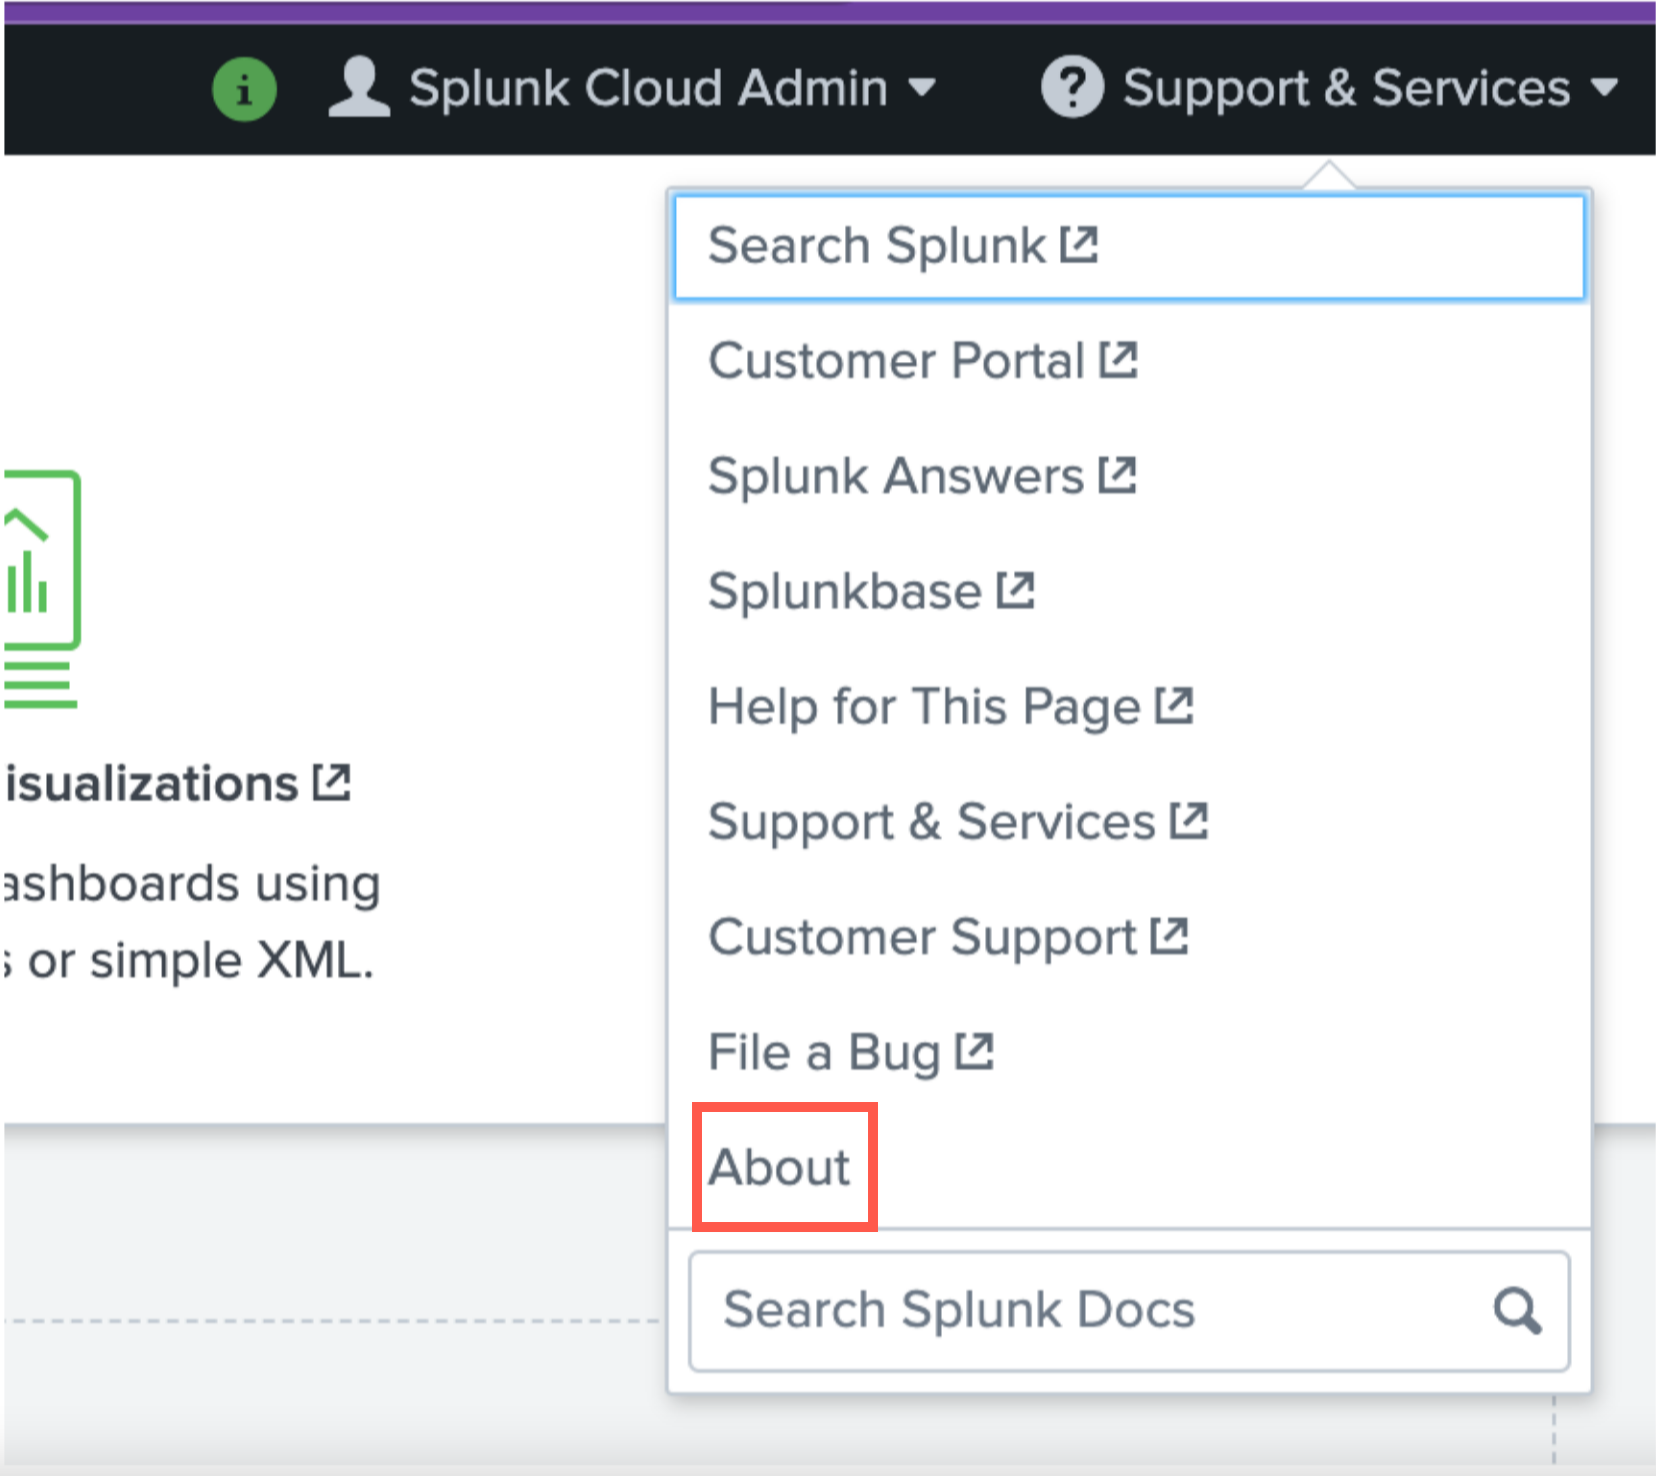
To verify your Splunk experience- Classic or Victoria:
- Log in to the Splunk Cloud Platform.
- Go to Support & Services-> About.
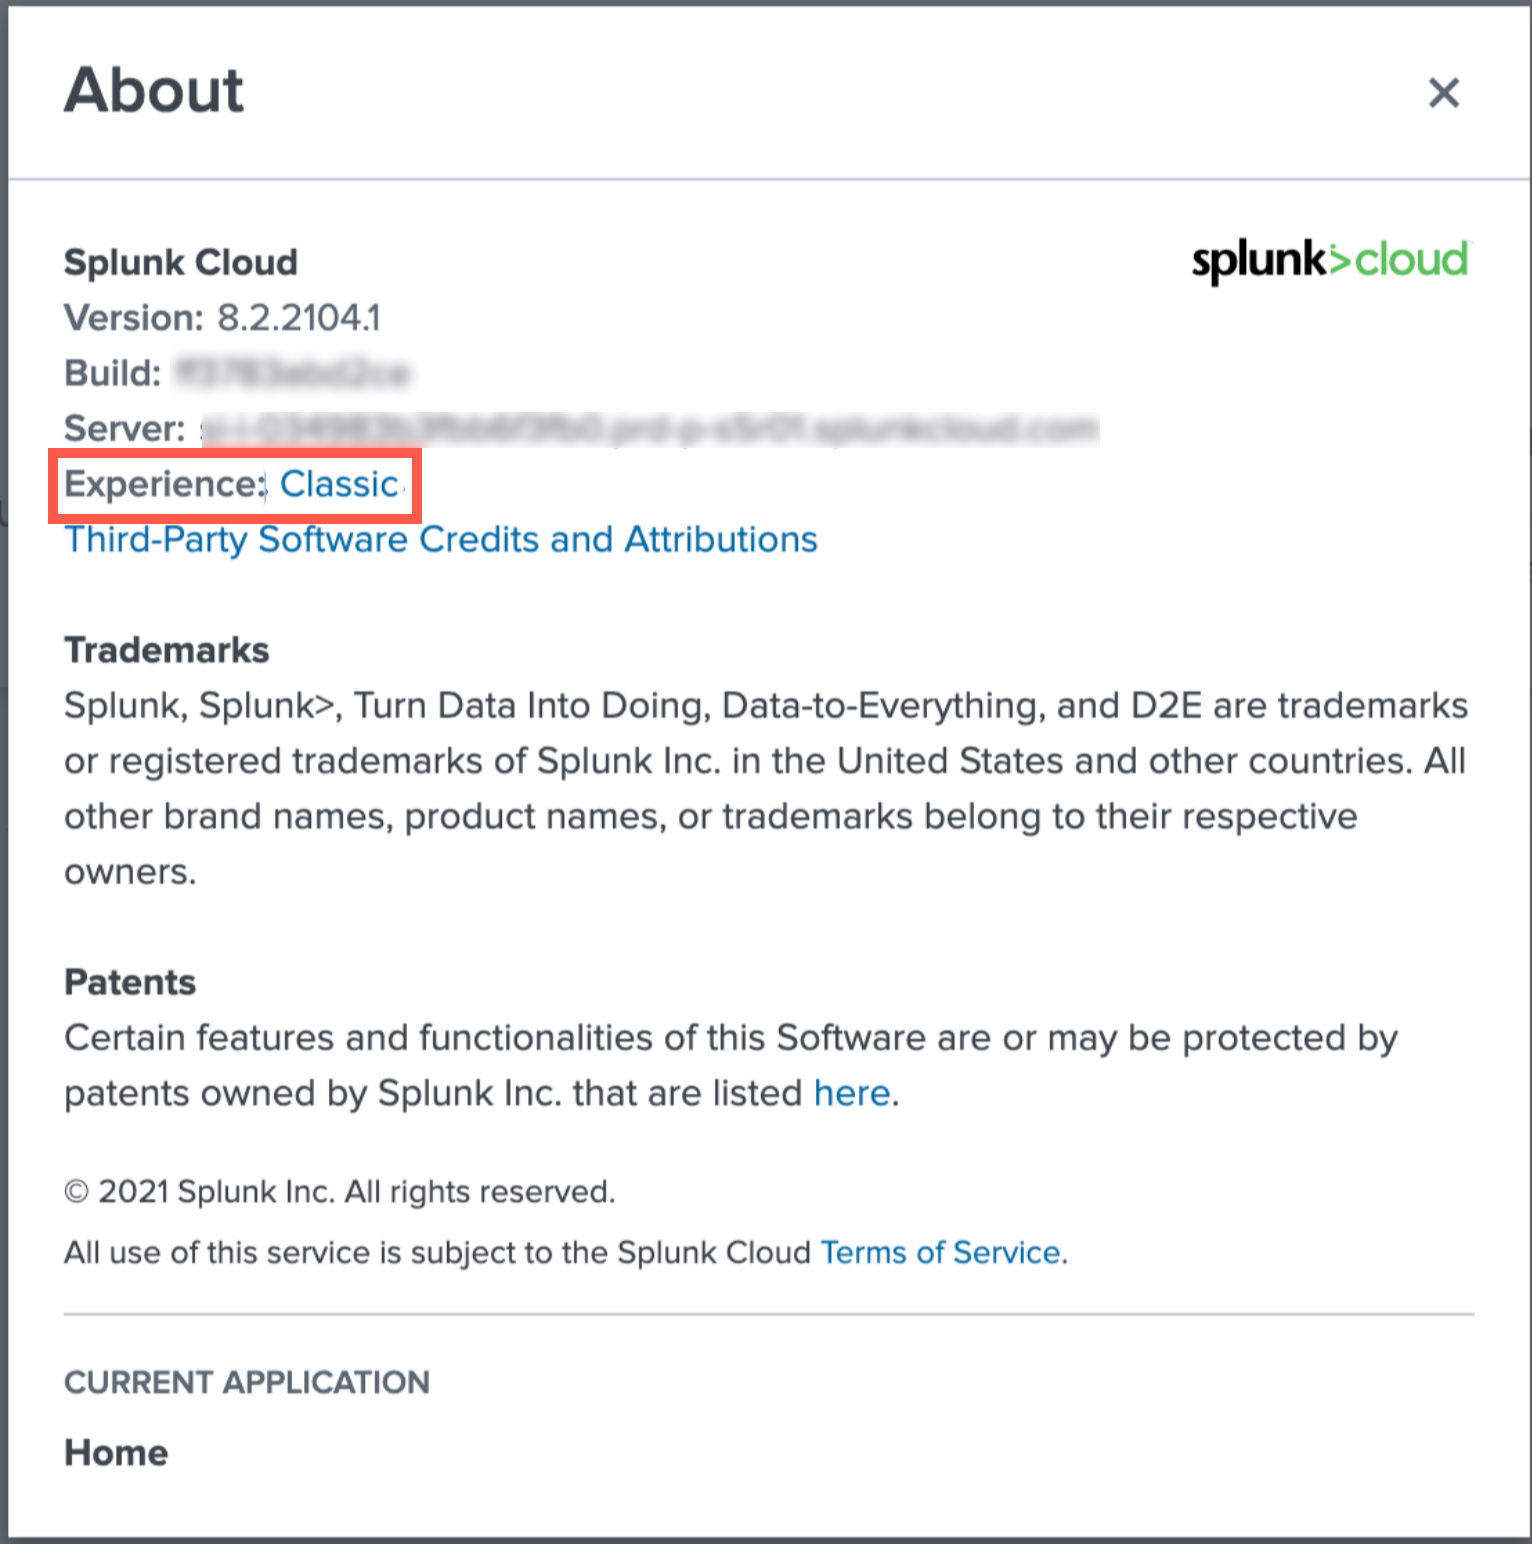
Configuring the Axis App in Splunk Cloud
To configure the Axis App:
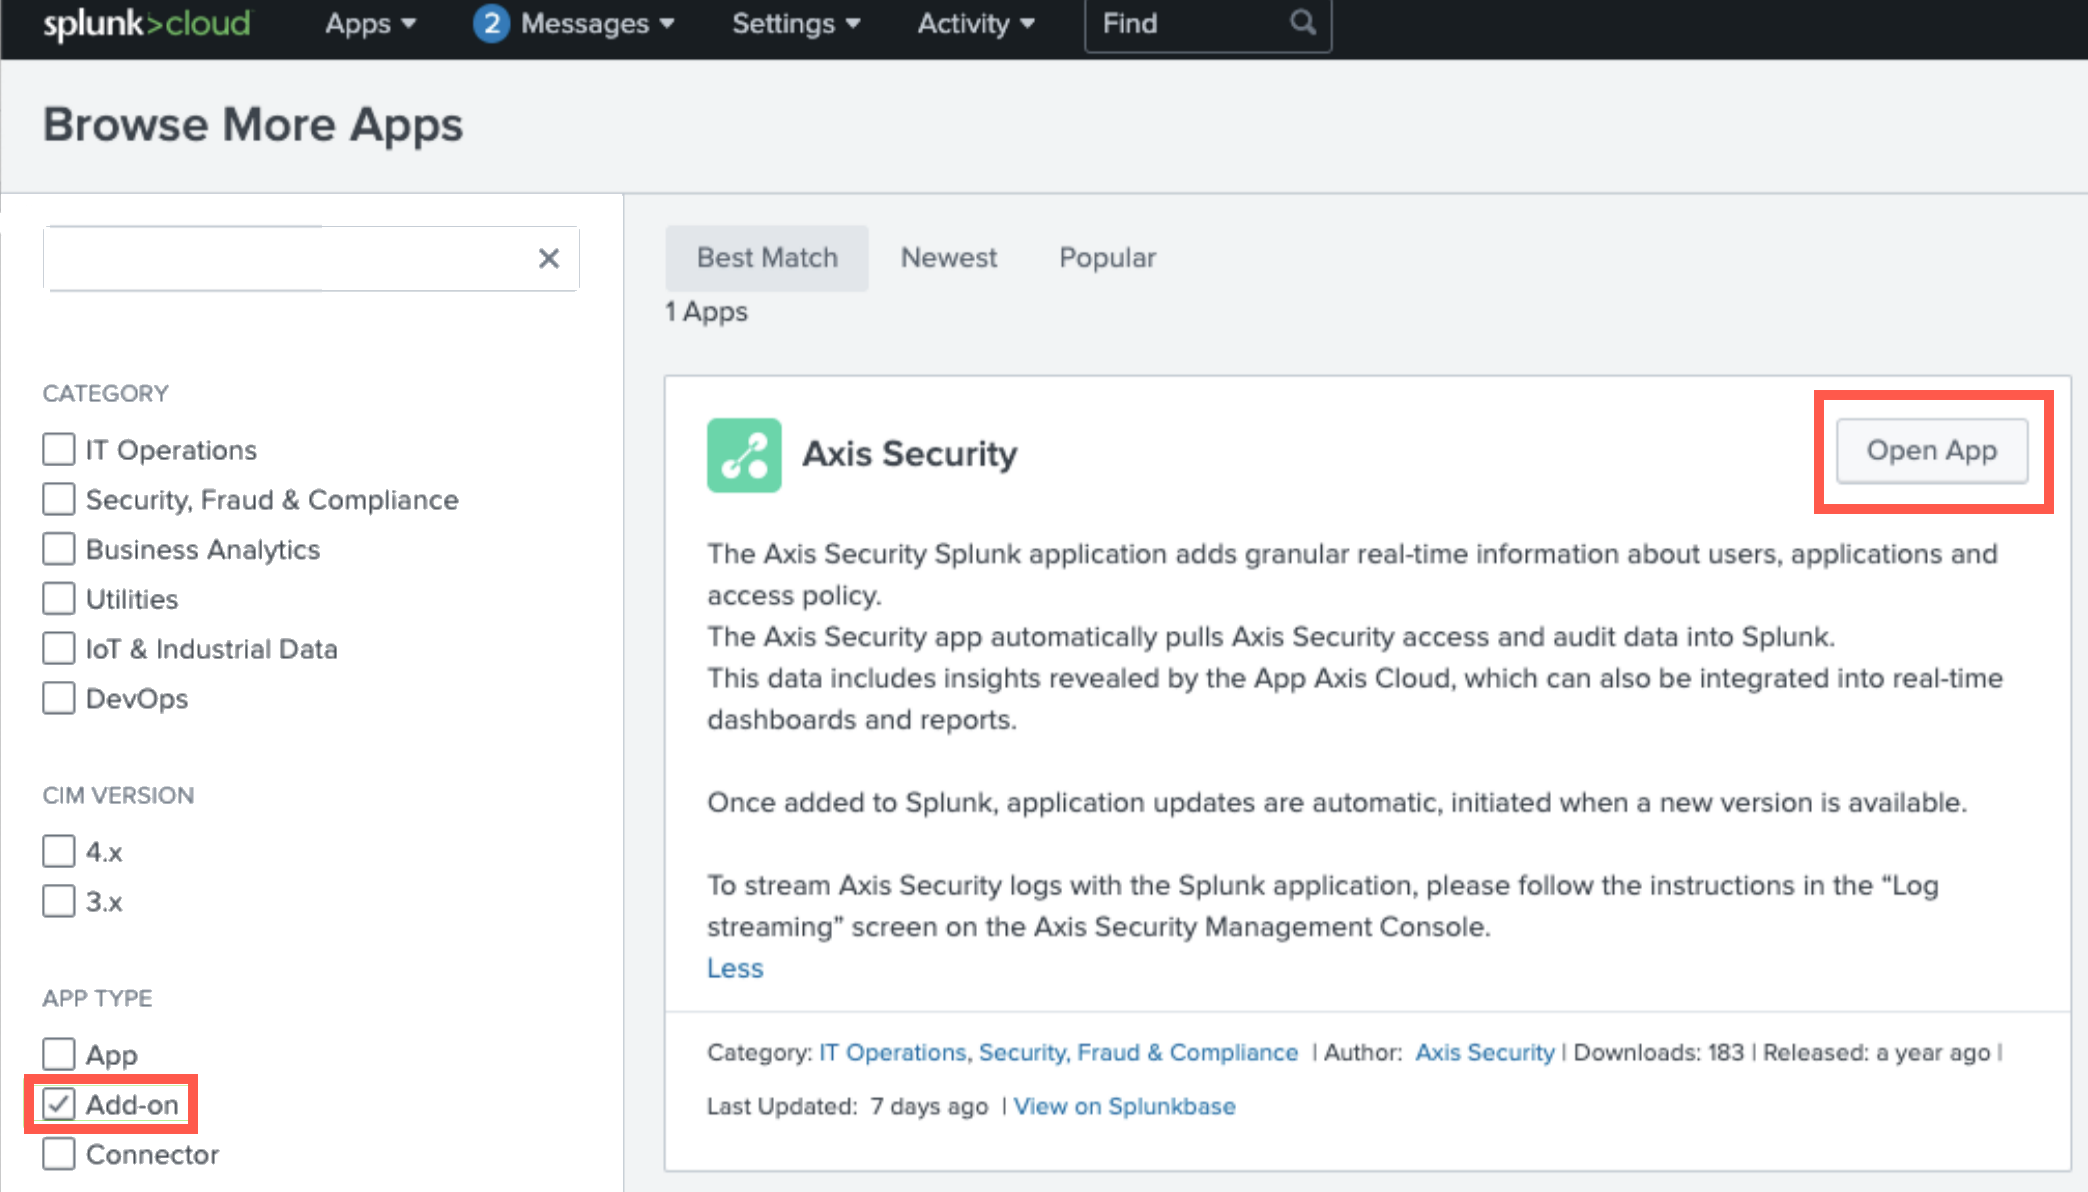
- Go to Apps-> Browse More Apps
- Search for “Axis”
- Click Install. If it is already installed, click Open App.
NoteYou will be prompted to restart the Splunk Server after installing. This is not required.
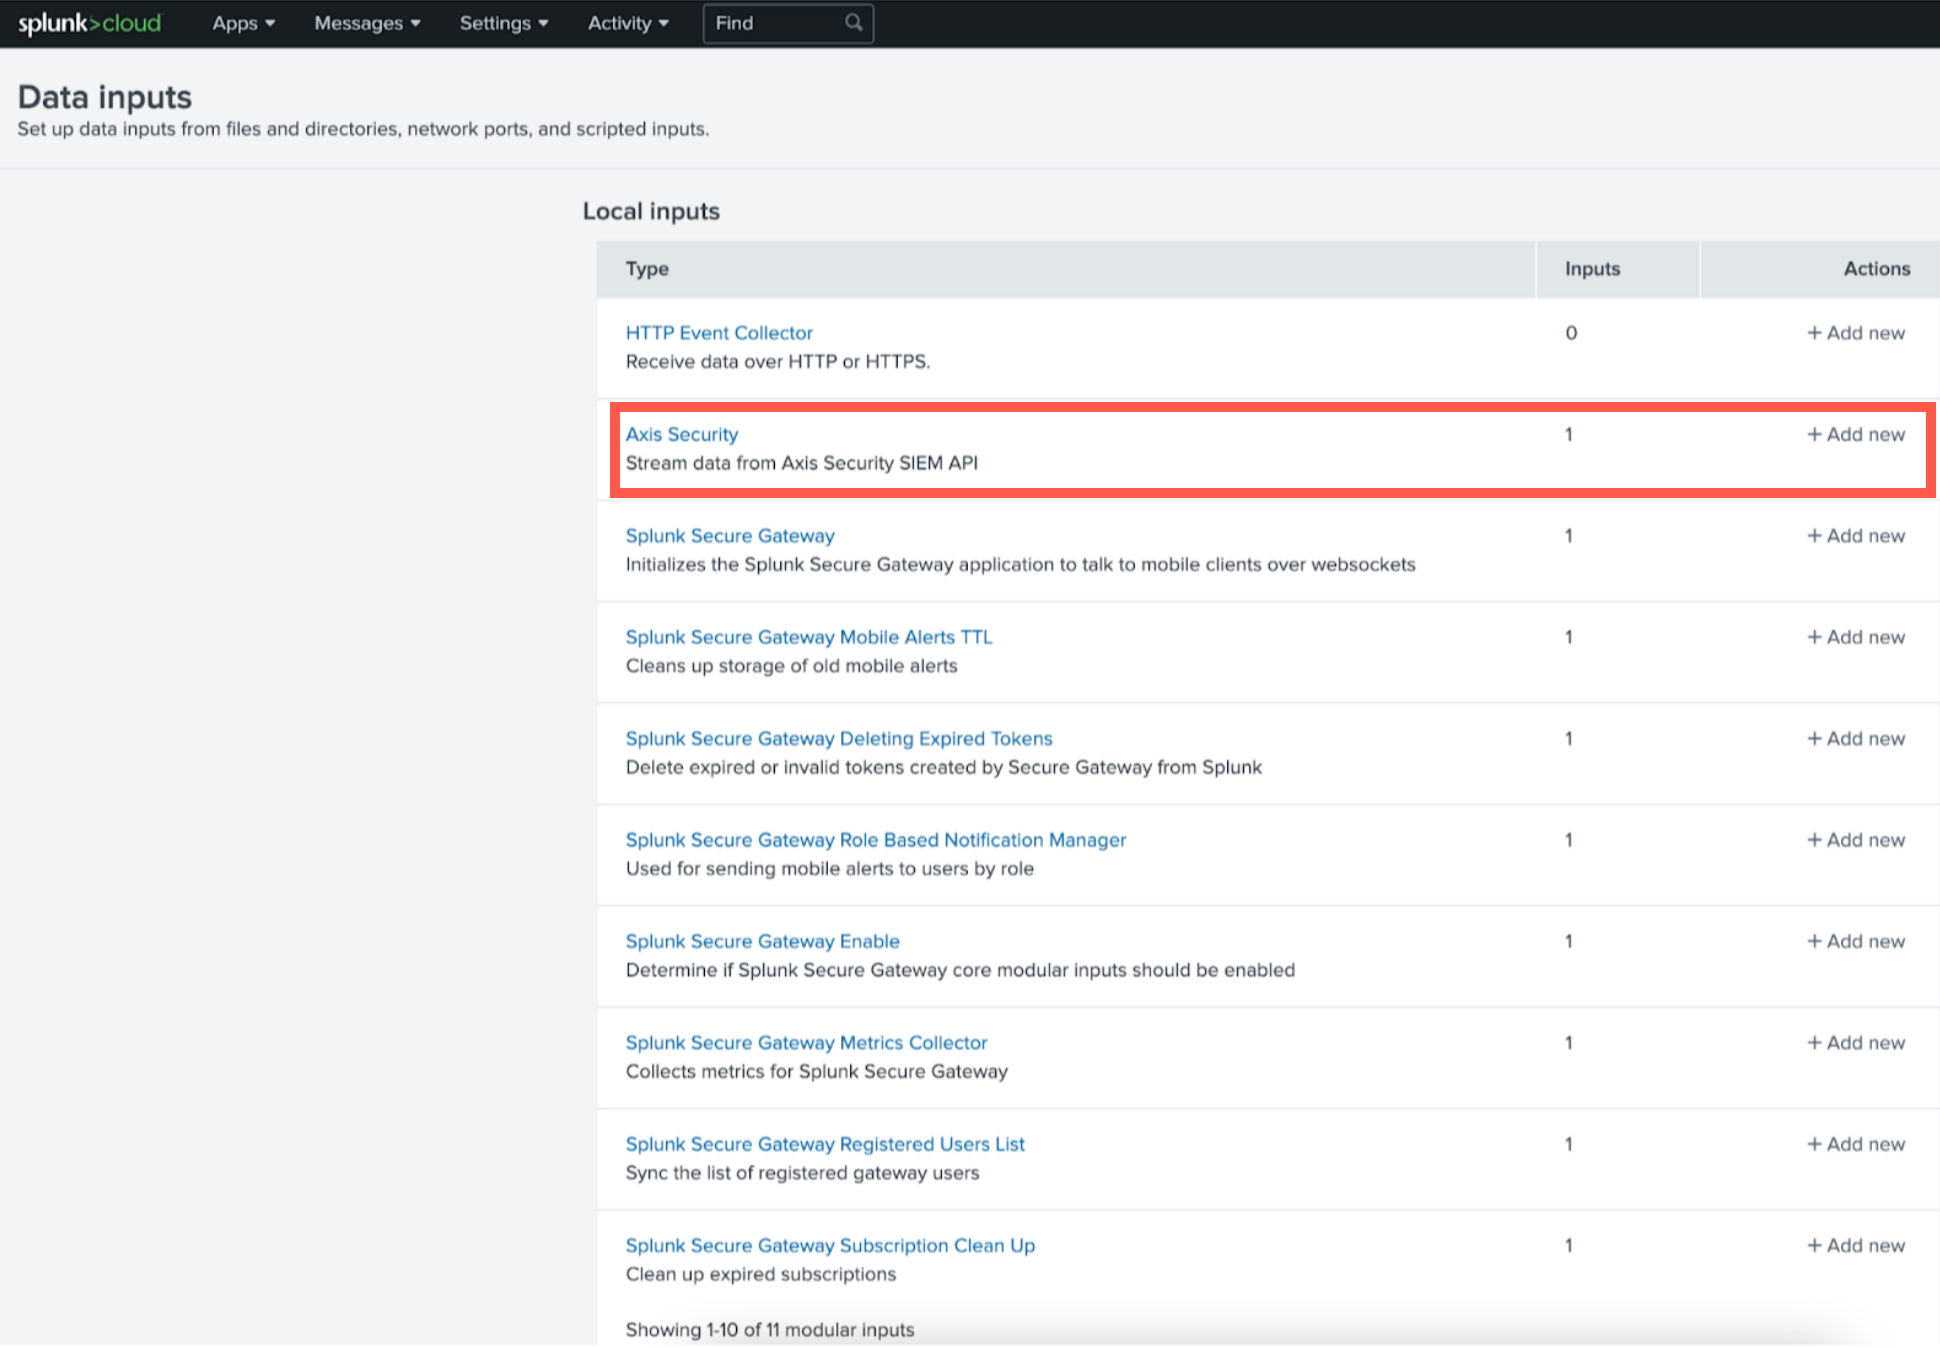
- Go to Settings-> Data Inputs.

- Find the Axis Security input type and click +Add New.
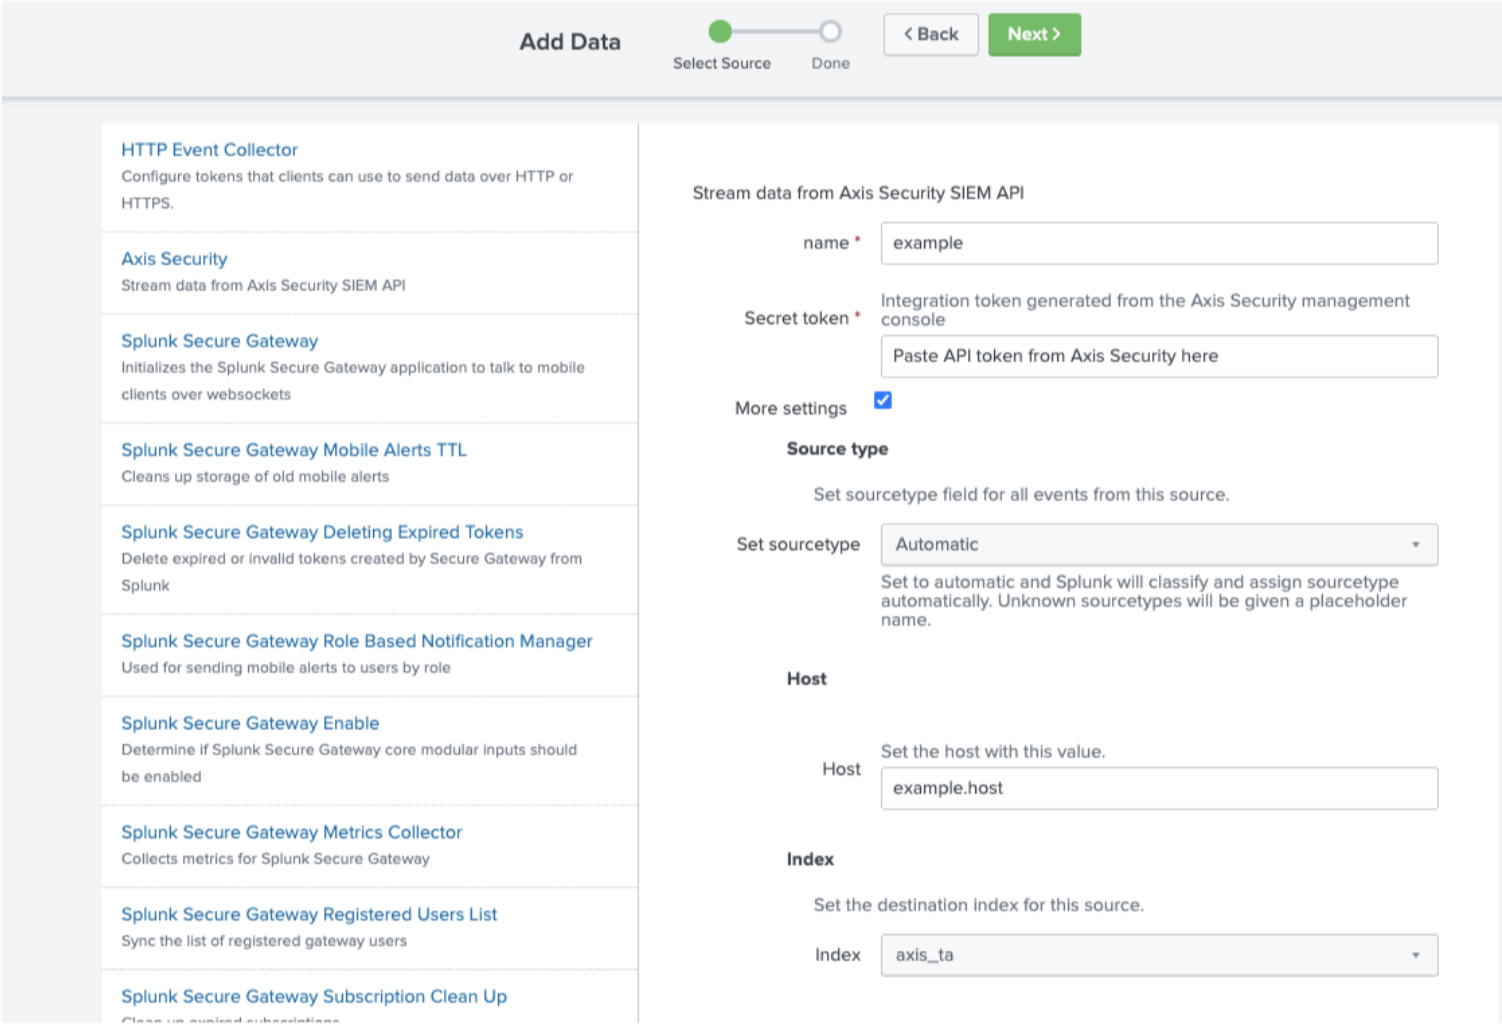
- Enter a name.
- Paste the API token from the Axis configuration into the Secret token field.
- Check the box for More settings to change the Host or Index used for the Axis logs.
- Click Next.
To view the data:
Go to Settings-> Data Inputs-> Axis Security.

Known Issues
In the Victoria experience, the Axis Security Data Input might not appear.
To go to the Axis Security Data Input configuration page, use one of the following methods:
- Log into the Splunk Cloud admin console and add the following path to the URL: /en-US/manager/launcher/adddatamethods/selectsource?input_type=axis_splunk_app∈put_mode=1&modinput=1
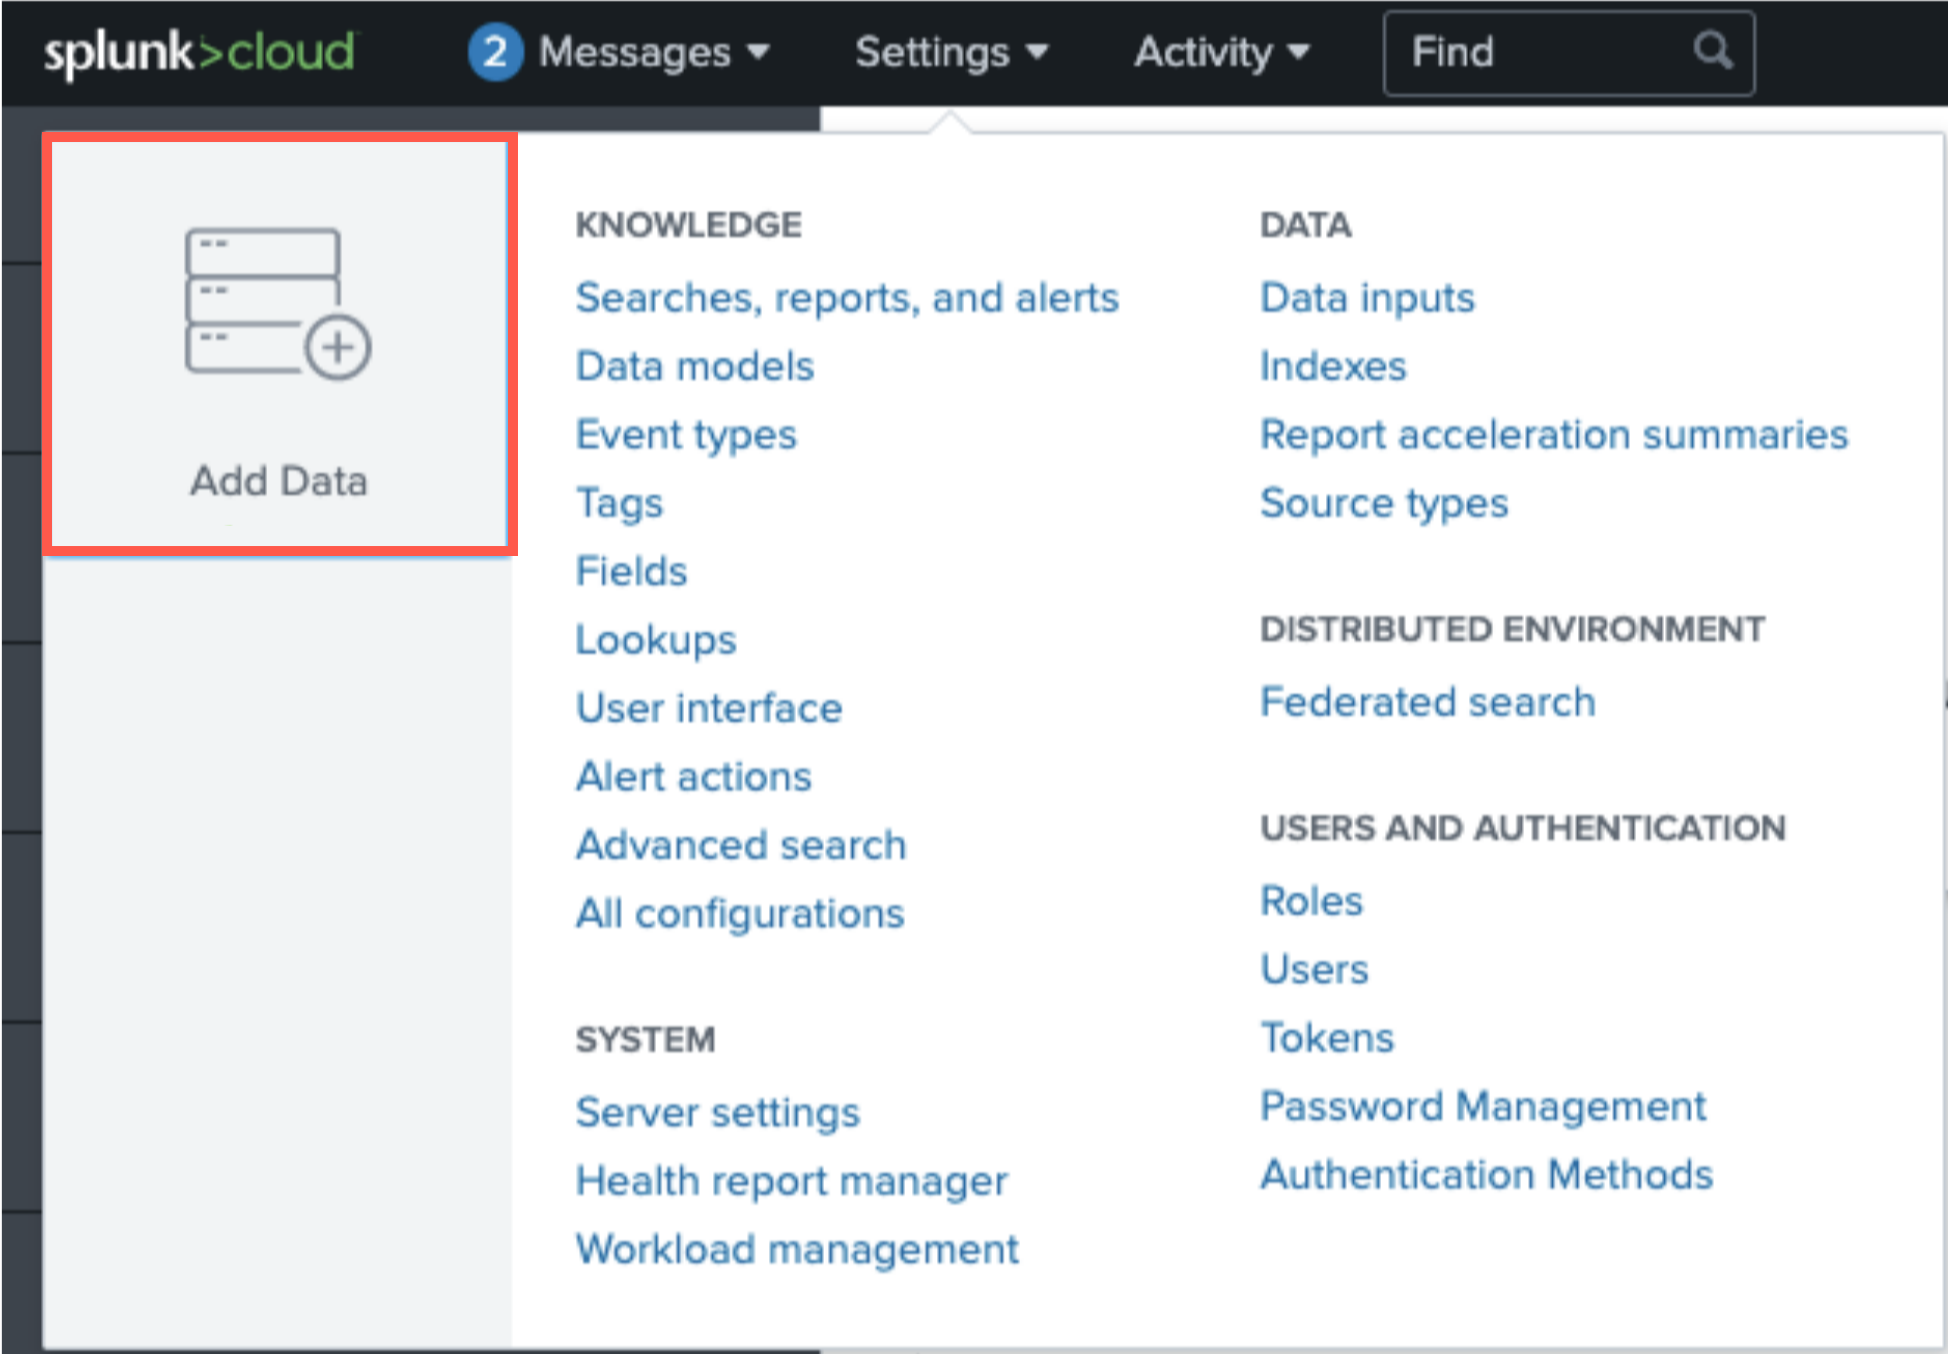
For example, if your Splunk Cloud host is https://demo.splunkcloud.com, you would go to https://demo.splunkcloud.com/**en-US/manager/launcher/adddatamethods/selectsource?input_type=axis_splunk_app&input_mode=1&modinput=1** - In the Splunk Admin Console, go to Settings-> Add Data. You will then see a full list of data inputs including Axis Security.
Using Splunk Logs
-
Click on the Axis Security icon in your Splunk main page.
-
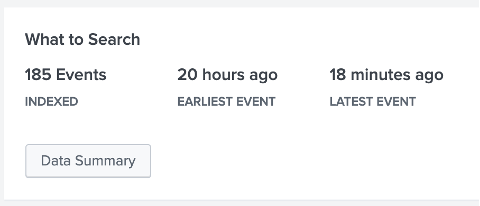
Click on Data Summary.
-
Select either Hosts or Sources (either “activityLog” or “auditLog”) or search for the relevant index in the search bar.
-
You should now see your Axis Security’s activity and audit log information.

Universal Forwarder
Installation
Note: When using Splunk Universal Forwarder keep in mind that you need to update the Axis Splunk app version manually since Universal Forwarder does not support auto update from SplunkBase.
Since forwarder has no UI the installation requires access to the forwarder’s server.
Extract the package. Run the command (notice the parameters):
tar xvzf <tar_folder>/axis_splunk_app.tar.gz -C < _path_toforwarder>/etc/apps
Configure input. Edit the file:
<path_to_forwarder>/etc/apps/axis_splunk_app/default/inputs.conf
Choose a name for your input and append the lines at the end:
axis_splunk_app://YourInputName]
token = <**_your_accesstoken>
index = <your_index**> (Optional. Default value - “main”)
Restart Splunk Forwarder. Run the command:
<path_to_forwarder>/bin/splunk stop
<path_to_forwarder>/bin/splunk start
Troubleshooting Sync Issues
The Log Streaming table provides the following sync status information:
| Synced | Log has synced successfully |
| Sync in progress | Log is currently syncing |
| Pending initial sync | Log has not synced yet |
| Not synced | Log has not synced recently, there may be a temporary sync issue. Indicates the time since the last successful sync |
If the integration sync indicator is red, take the following action:
- Splunk Cloud and Splunk Enterprise: Disable and then enable the Axis input.
- Go to Settings --> Data Inputs --> Axis Security
- Click Disable and then Enable.
- If the issue was not solved, in the Search, search for index="_internal" sourcetype="splunkd" axis_splunk_app and contact Axis Support: [email protected] with the information
Updated 2 months ago
