Activity Exploration
About Activity Exploration
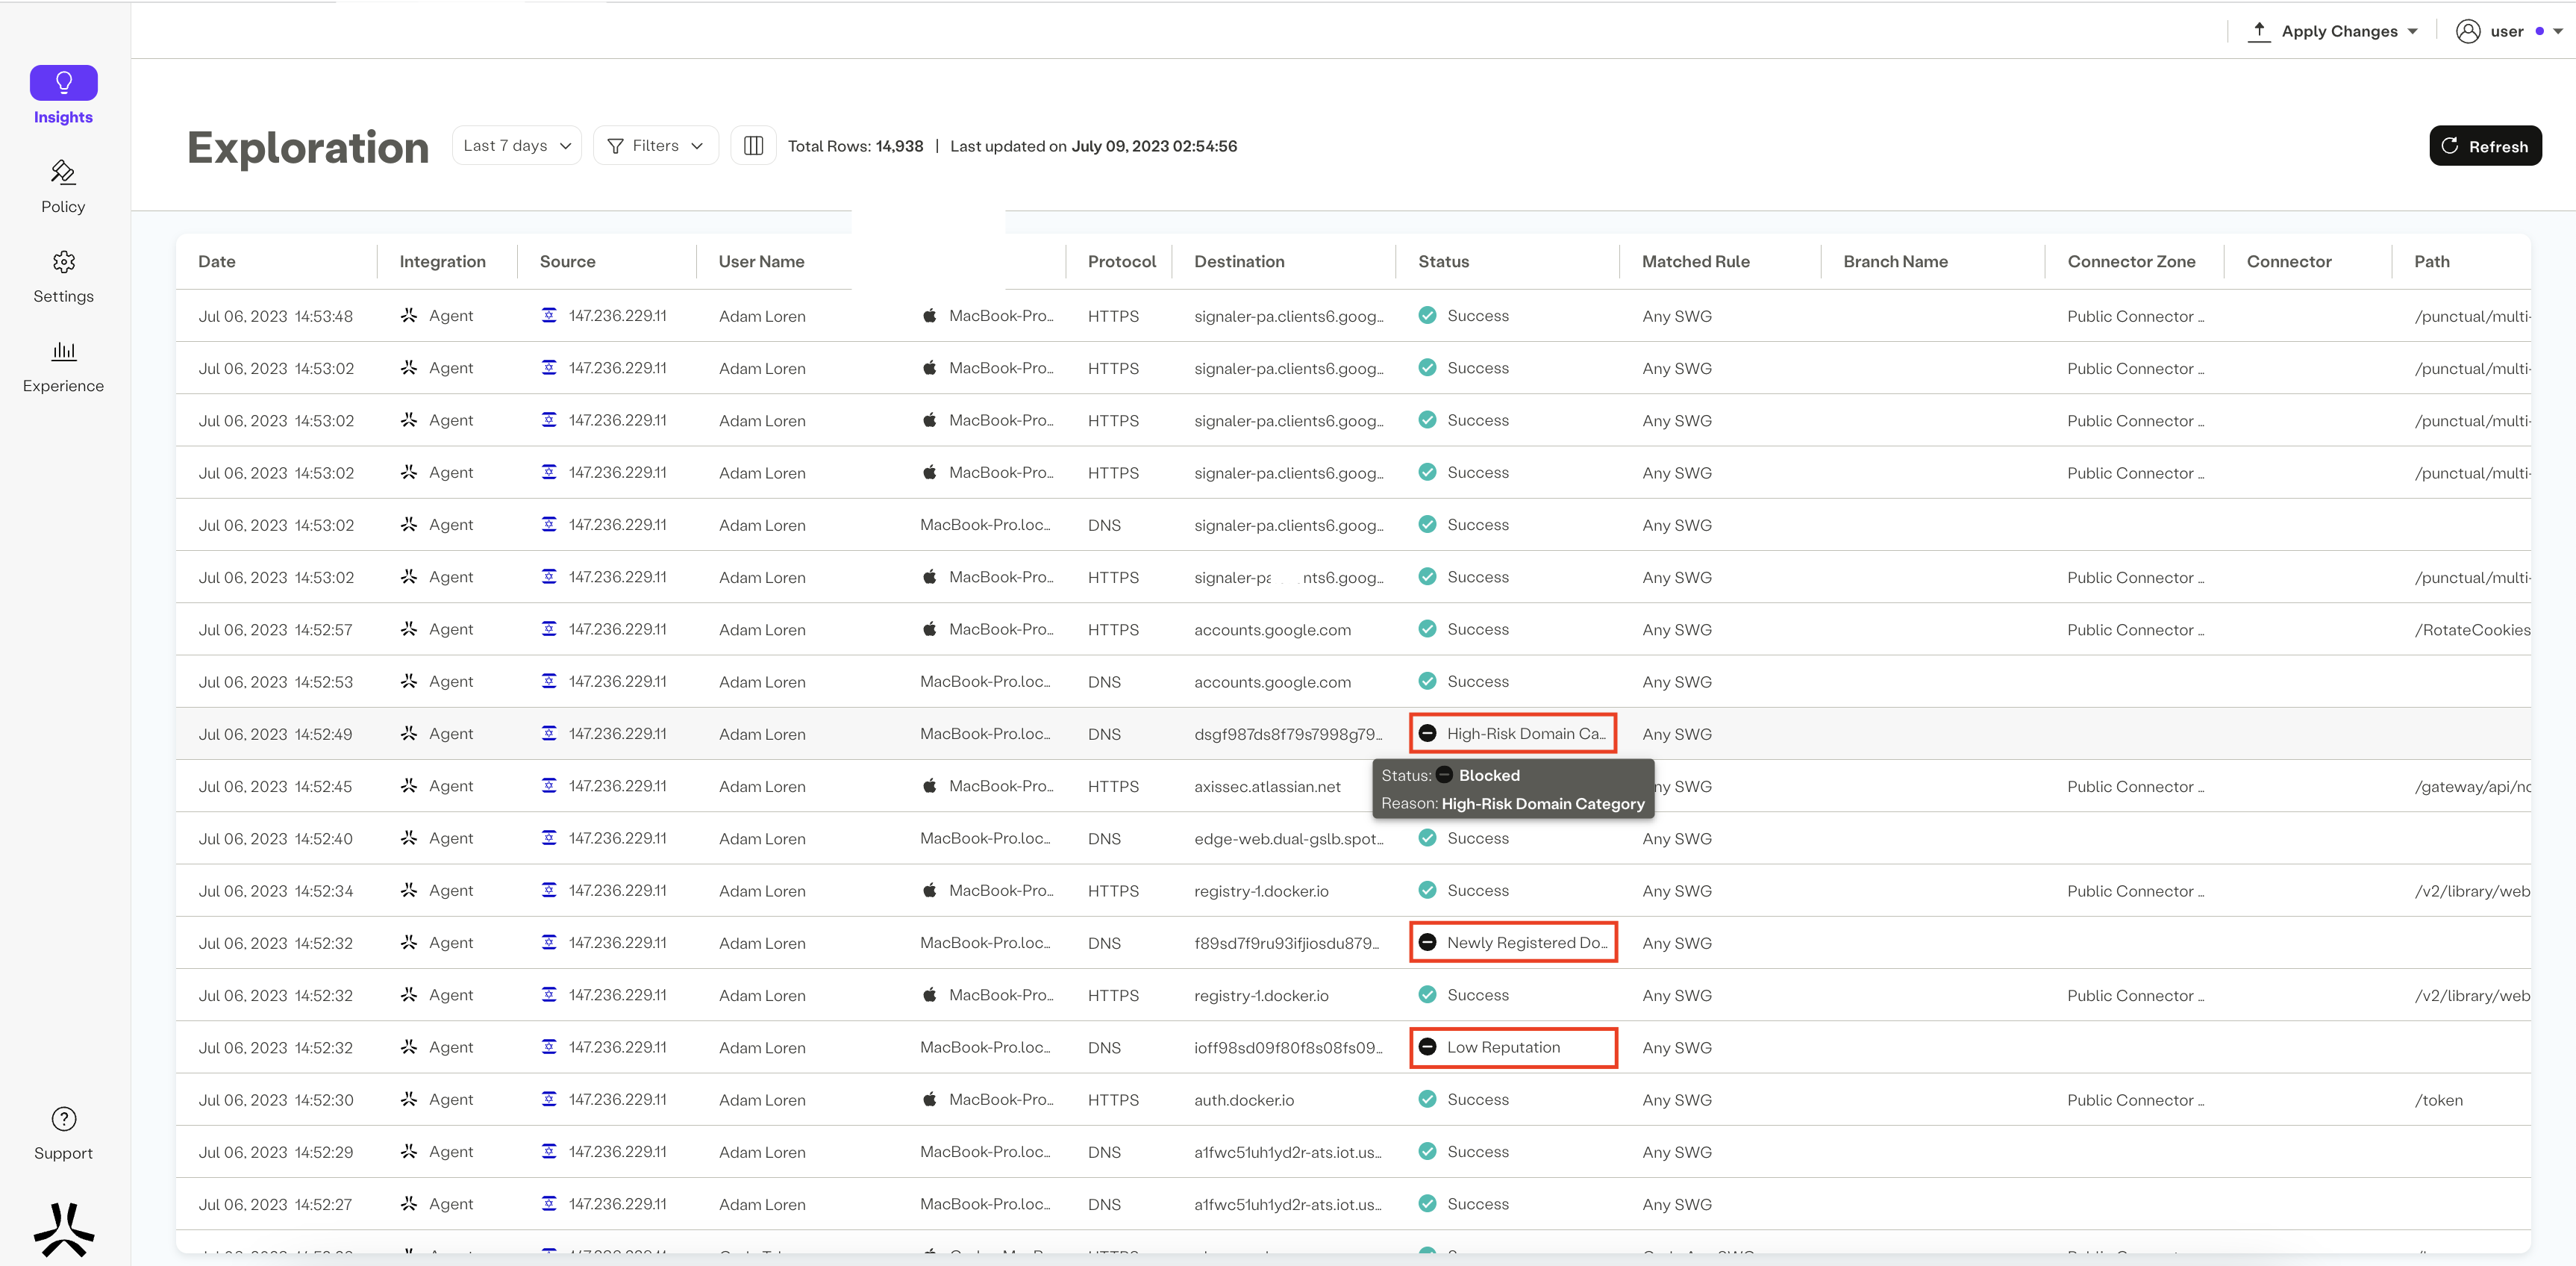
Activity Exploration harnesses the power of the Atmos unified SSE platform by providing insights across all ZTNA, SWG and CASB activity in a single comprehensive screen. The Activity Exploration screen in Atmos is a powerful tool that provides users with comprehensive visibility and control over user activity data. This screen streamlines the process of exploring and analyzing user activity, allowing you to remediate and gain valuable insights with ease. By centralizing data from various sources, Atmos ensures that you have access to all the necessary information to make informed decisions and maximize the value of your data.
Click here to watch a demo.
Capabilities of the Activity Exploration Screen
The Activity Exploration screen offers a range of capabilities to help you efficiently manage and analyze user activity data:
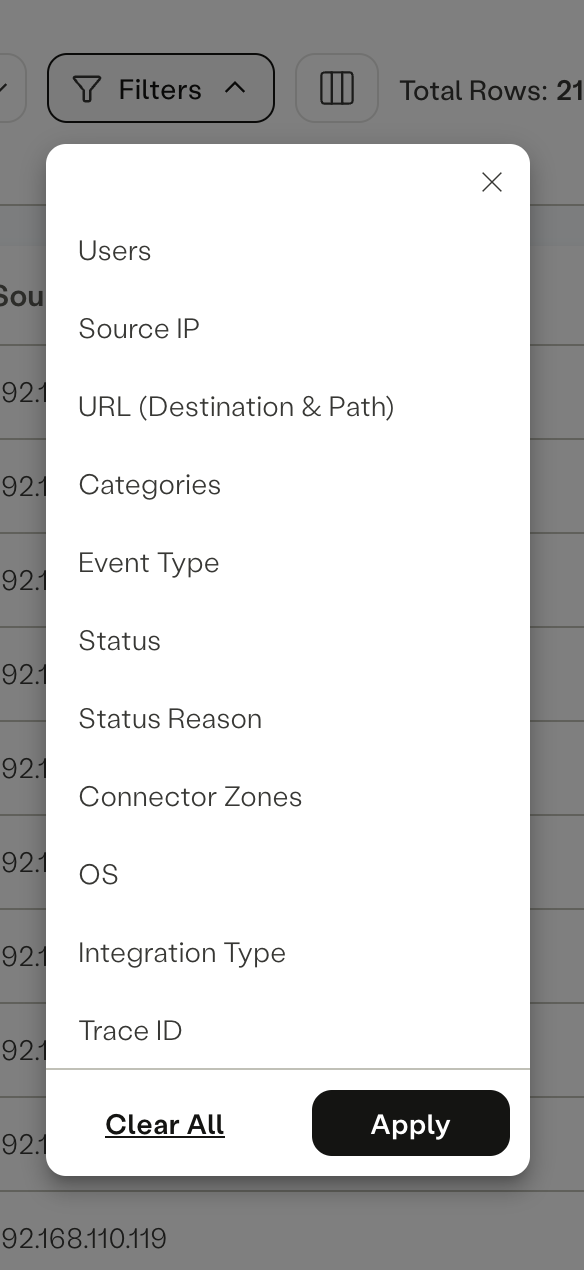
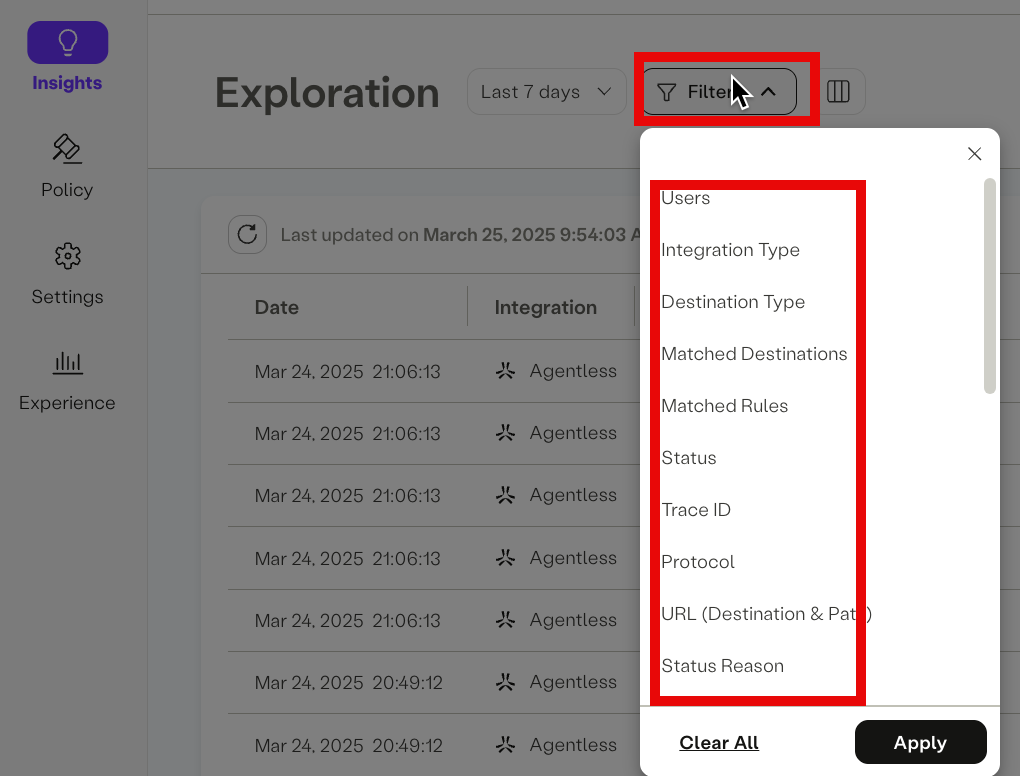
Filters
-
Time Filter: The Time Filter allows you to focus on specific time periods. You can choose from predefined time ranges or customize your time range selection, which can span up to a month.
-
Users Filter: The Users Filter enables you to access events associated with specific users. This filter provides insights into individual user activity. Individual users are selectable with IdP-specific granularity.
-
Source IP: Filter events based on the source IP address, which can help identify patterns and potential security issues.
-
URL: Filter events related to specific URLs (Both Domains and path). The URL filter can also show partial matches on a given string. For example “axissecurity” will match all of www.axissecurity.com, ops.axissecurity.com, notaxissecurity.com
-
Categories: Categorize events based on predefined or custom categories, making it easier to identify and address specific types of incidents.
-
Event Type: Filter events by their type, allowing you to focus on specific event categories, such as login attempts or data transfers.
-
Status: Filter events by their status (e.g., success, block, error) to quickly identify and address issues.
-
Status Reason: Drill down further by filtering events based on the reason for their status, providing deeper context. Alternate suggestion: Refined filter to look for specific types of block and error events providing deeper context
-
Connector Zone: Filter events by the egressing connector zone. This helps , helping you distinguish between internal and external traffic, or identify traffic on a per-site basis..
-
OS: Filter events based on the operating system, which can be useful for identifying vulnerabilities or specific user behavior.
-
Integration Type: Filter events by the integration type, such as IPsec, Agentless, or Agent, to understand the source of the event.
-
Trace ID: Filter events by their trace ID, which is essential for troubleshooting purposes.
-
Protocol: Filter events based on the protocol used, including HTTP/S and DNS.
Hide and Show Columns
You have the flexibility to customize the table columns to suit your specific needs. This feature allows you to hide columns that are not relevant at the moment, reducing clutter and focusing on the information that matters.
Reorganize Table Columns
Reorganizing table columns provides the ability to structure data based on the context you want to see. This feature enables you to arrange columns in a way that enhances your understanding of the data.
Sticky URL
The Sticky URL feature allows you to copy the URL with specific filters and share it with others. Whether using predefined or custom time ranges, sharing URLs ensures that others can view the exact data and events you are working on.
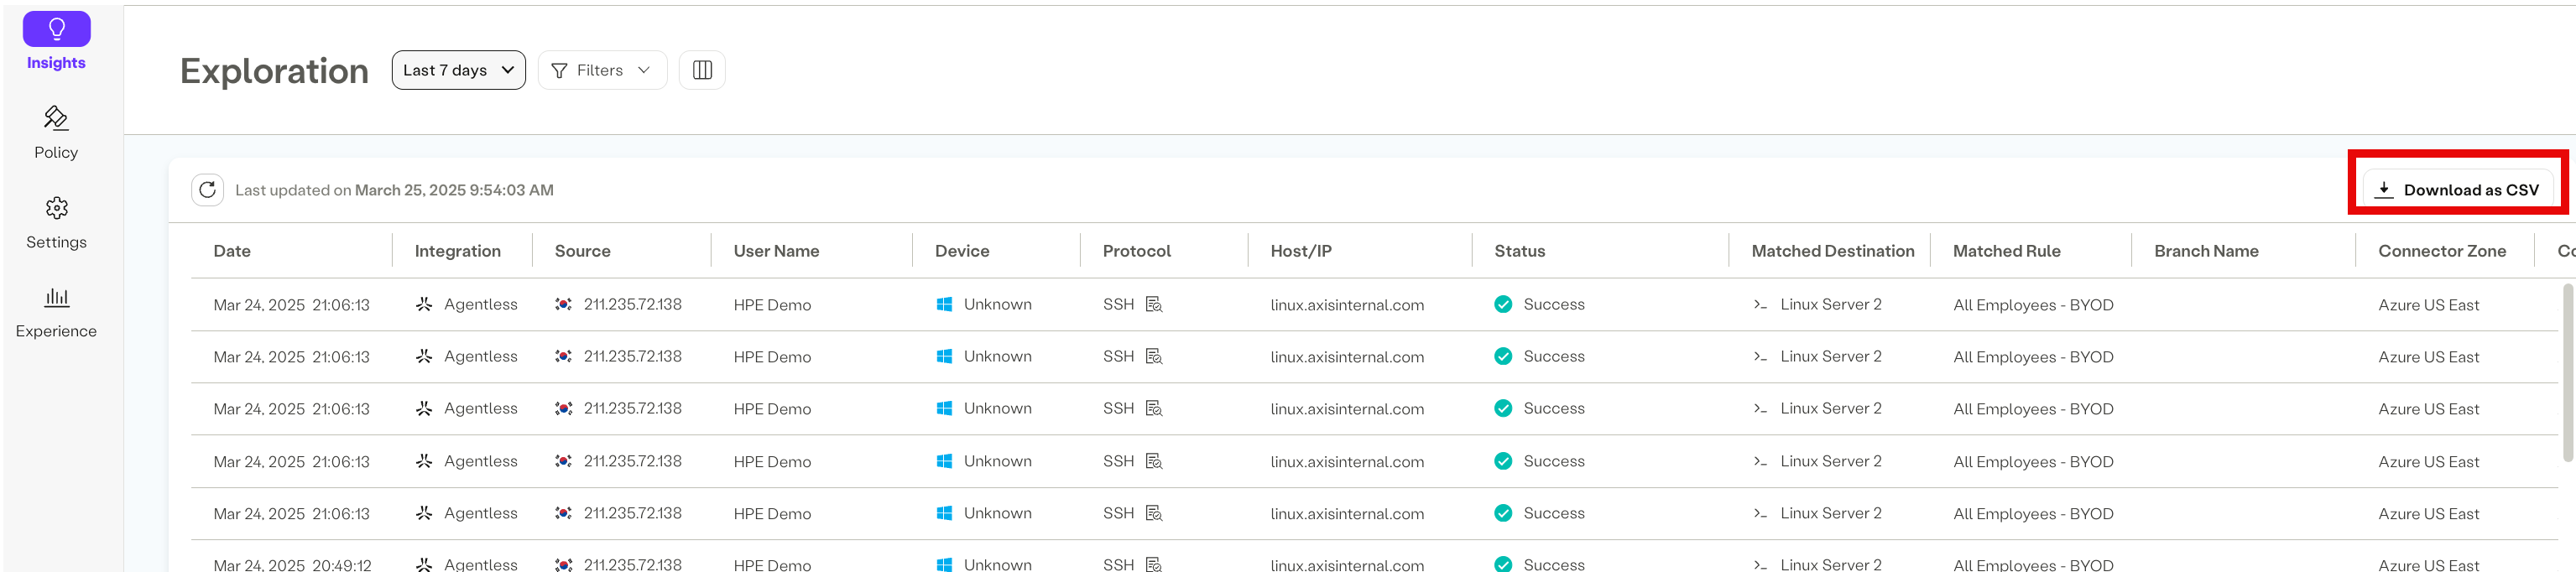
Exploration Log Export
You can export exploration logs to a CSV file.
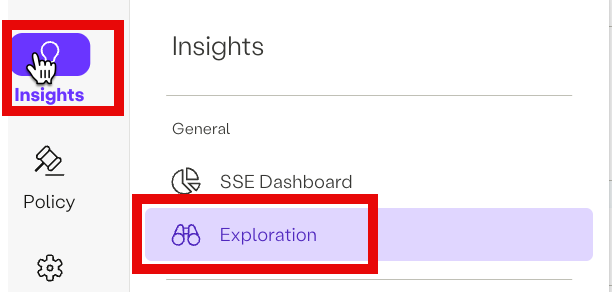
- Navigate to Insights → Exploration
- Apply desired filters
- Select Download as CSV to save your data.
Note
- A maximum of 10,000 entries can be exported
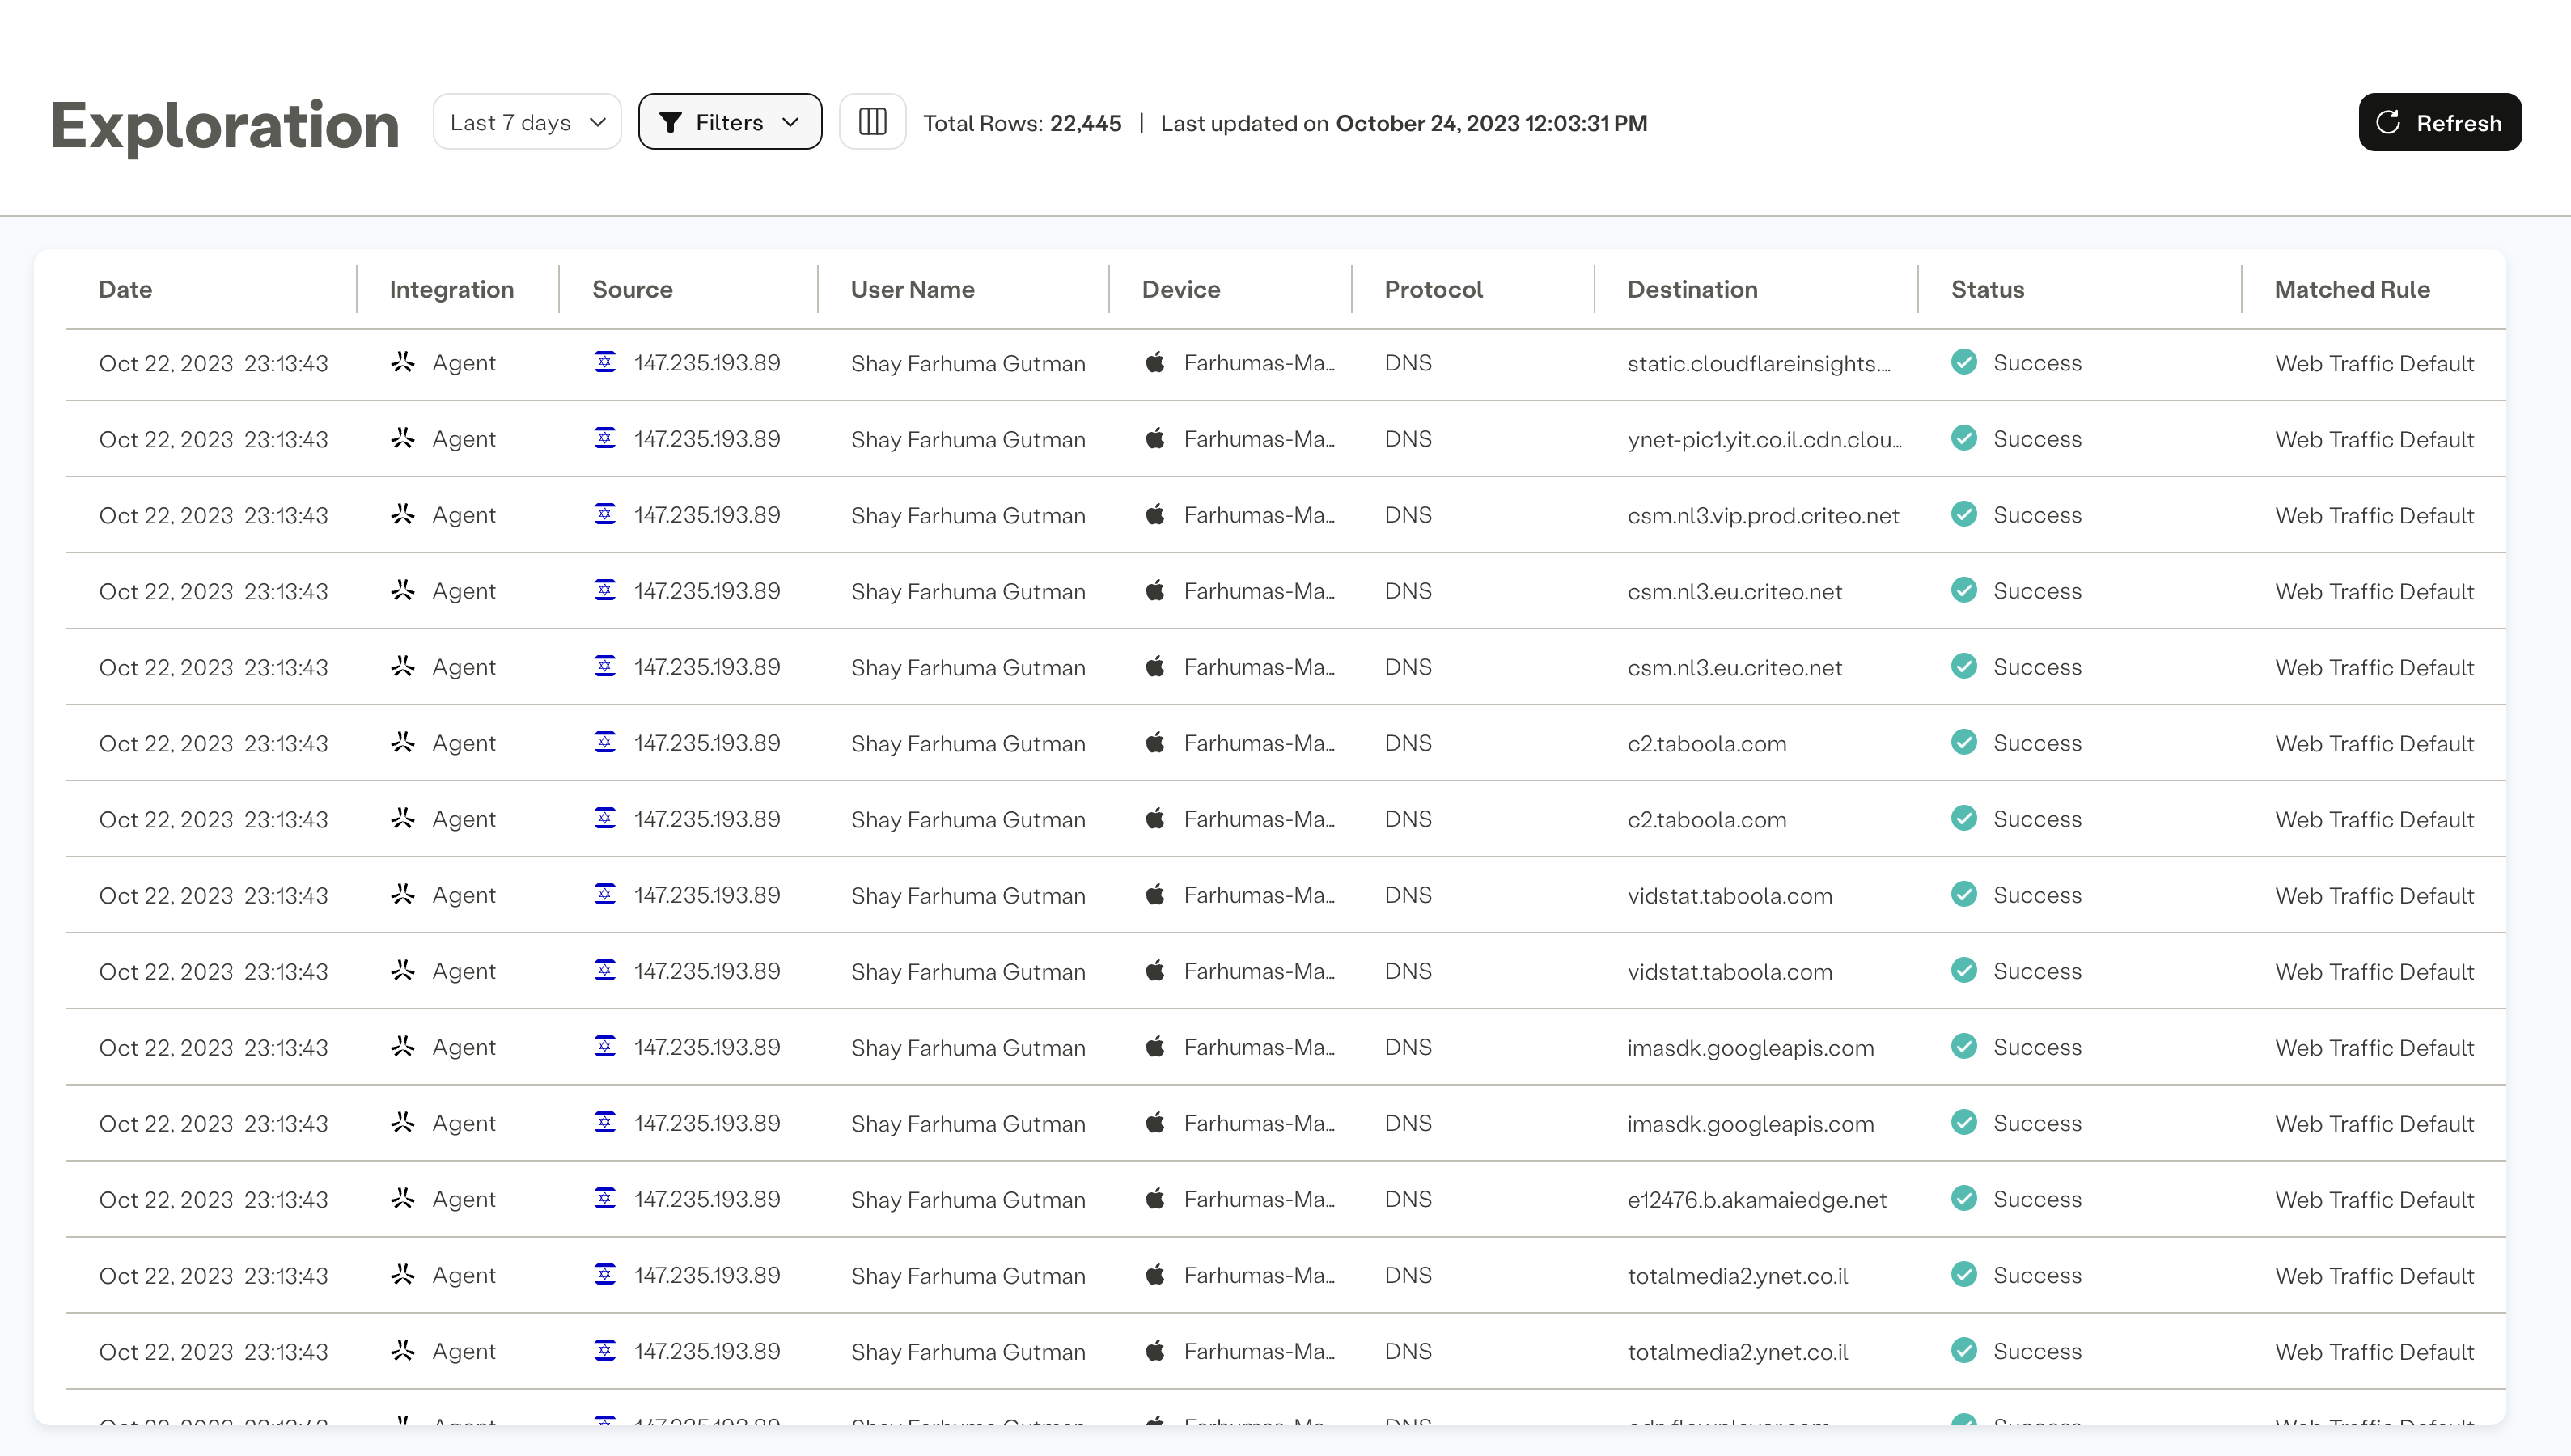
Data Available in the Table
The table in the Activity Exploration screen contains various columns, each providing essential information about the events:
-
Date: Timestamp of when the event occurred.
-
Integration: Identifies the source that generated the event, such as IPsec, Agentless, or Agent.
-
Source: Displays the source IP address, including the user's geo-location when available.
-
User Name: Shows the user's display name. When no specific user is authenticated, this column displays "Anonymous."
-
Device and OS: Provides information about the device name and operating system, if available.
-
Protocol: Displays the protocol associated with the event, including HTTP/S and DNS.
-
Destination: Shows the domain or IP address that the user attempted to access.
-
Status and Reason: Reflects the status of the event (e.g., success, block, error) and provides the reason for the block or error.
-
Matched Rule: Indicates the rule that was matched for the event.
-
Branch Name: Displays the branch name when accessing with IPsec.
-
Connector Zone: Shows the connector zone name, with "Public connector zone" displayed for external traffic that egresses from the default Public connector zone offered by Axis.
-
Connector: Identifies the specific connector within the connector zone that the event passed through to reach the Destinationfor external traffic.
-
Path: Specifies the path accessed by the user.
-
HTTP Status Code: For HTTP/S traffic, this column displays the HTTP status code, providing insights into the outcome of the event.
-
Port: Indicates the TCP/UDP port that was accessed during the event.
-
HTTP Method: Displays the common HTTP/S methods used.
-
Categories: Shows which predefined or custom category is the categories associated with the destination
-
Application: For internal traffic, this column displays self-hosted application naming. For external traffic, it indicates the destination name associated with the address.
-
SaaS Category: Specifies the SaaS category associated with the URL, this is different from the category column.
-
Action: Indicates the action taken in the event. This information is enriched for some external traffic events.
-
Trace ID: Provides the trace ID for the event, facilitating troubleshooting for block and error events.
Examples of Use Cases
Here are some examples of how you can leverage the capabilities of the Activity Exploration screen:
-
Incident Response Use the "Status" and "Status Reason" filters to quickly identify and respond to security incidents.
-
User Behavior Analysis: Apply the "Users" filter to focus on the activity of specific users and gain insights into their behavior.
-
Network Troubleshooting: Utilize the "Source IP" filter to investigate network issues and anomalies.
-
Application Monitoring: Monitor application usage by analyzing the "Destination" and "HTTP Status Code" columns.
-
Compliance Reporting: Generate compliance reports by filtering events based on predefined categories and date ranges.
-
URL Investigation: Investigate suspicious URLs by filtering events based on the "URL" column.
-
Sharing Insights: Share specific event views with colleagues using the "Sticky URL" feature to collaborate effectively.
The Activity Exploration screen in Atmos provides a unified and user-friendly interface for managing user activity data, enabling you to make informed decisions and enhance your organization's cybersecurity posture. Explore its capabilities and tailor them to your specific needs to unlock the full potential of your data analysis efforts.
- Go to Insights -> Exploration.
Updated 5 months ago